
Getting Started#
Use sysplot to create consistent, publication-quality figures for control systems analysis. The package provides utilities for figure sizing, styling, and visualizations like Bode plots and Nyquist diagrams.
Install sysplot#
sysplot is available on PyPI. With Python 3.11 or higher, you can install the package with uv or pip:
uv add sysplot
pip install sysplot
If you already have the sysplot repository cloned locally on your machine and want to use it in another project, install it in editable mode:
uv pip install -e relative/path/to/sysplot
pip install -e path/to/sysplot
After installing, confirm that sysplot is available by running:
import sysplot
print(sysplot.__version__)
If no error is raised, the installation was successful.
Examples#
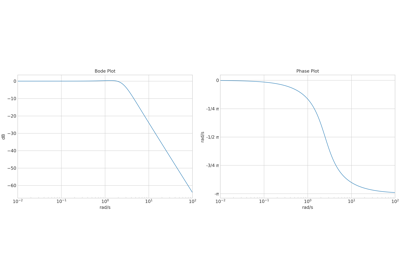
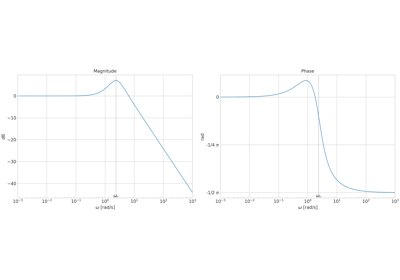
To get a quick overview of the module, check out either of these examples. The quick start example
covers most features provided by sysplot, while the minimum example shows how to create a Bode plot with a single call to sysplot.plot_bode().
Development Installation#
If you want to contribute to sysplot, please clone the repository and set up a development environment. You can refer to the CONTRIBUTING.md file for guidelines on code style, running tests, and building the documentation.
git clone https://github.com/JaxRaffnix/sysplot.git
cd sysplot
uv sync --extra dev --extra docs
git clone https://github.com/JaxRaffnix/sysplot.git
cd sysplot
python -m venv .venv
.venv\Scripts\Activate
pip install -e ".[dev,docs]"
git clone https://github.com/JaxRaffnix/sysplot.git
cd sysplot
python -m venv .venv
source .venv/bin/activate
pip install -e ".[dev,docs]"
Next Steps#
Concepts — understand the design principles behind sysplot.
API Reference — full API reference for all public functions.