
Note
Go to the end to download the full example code.
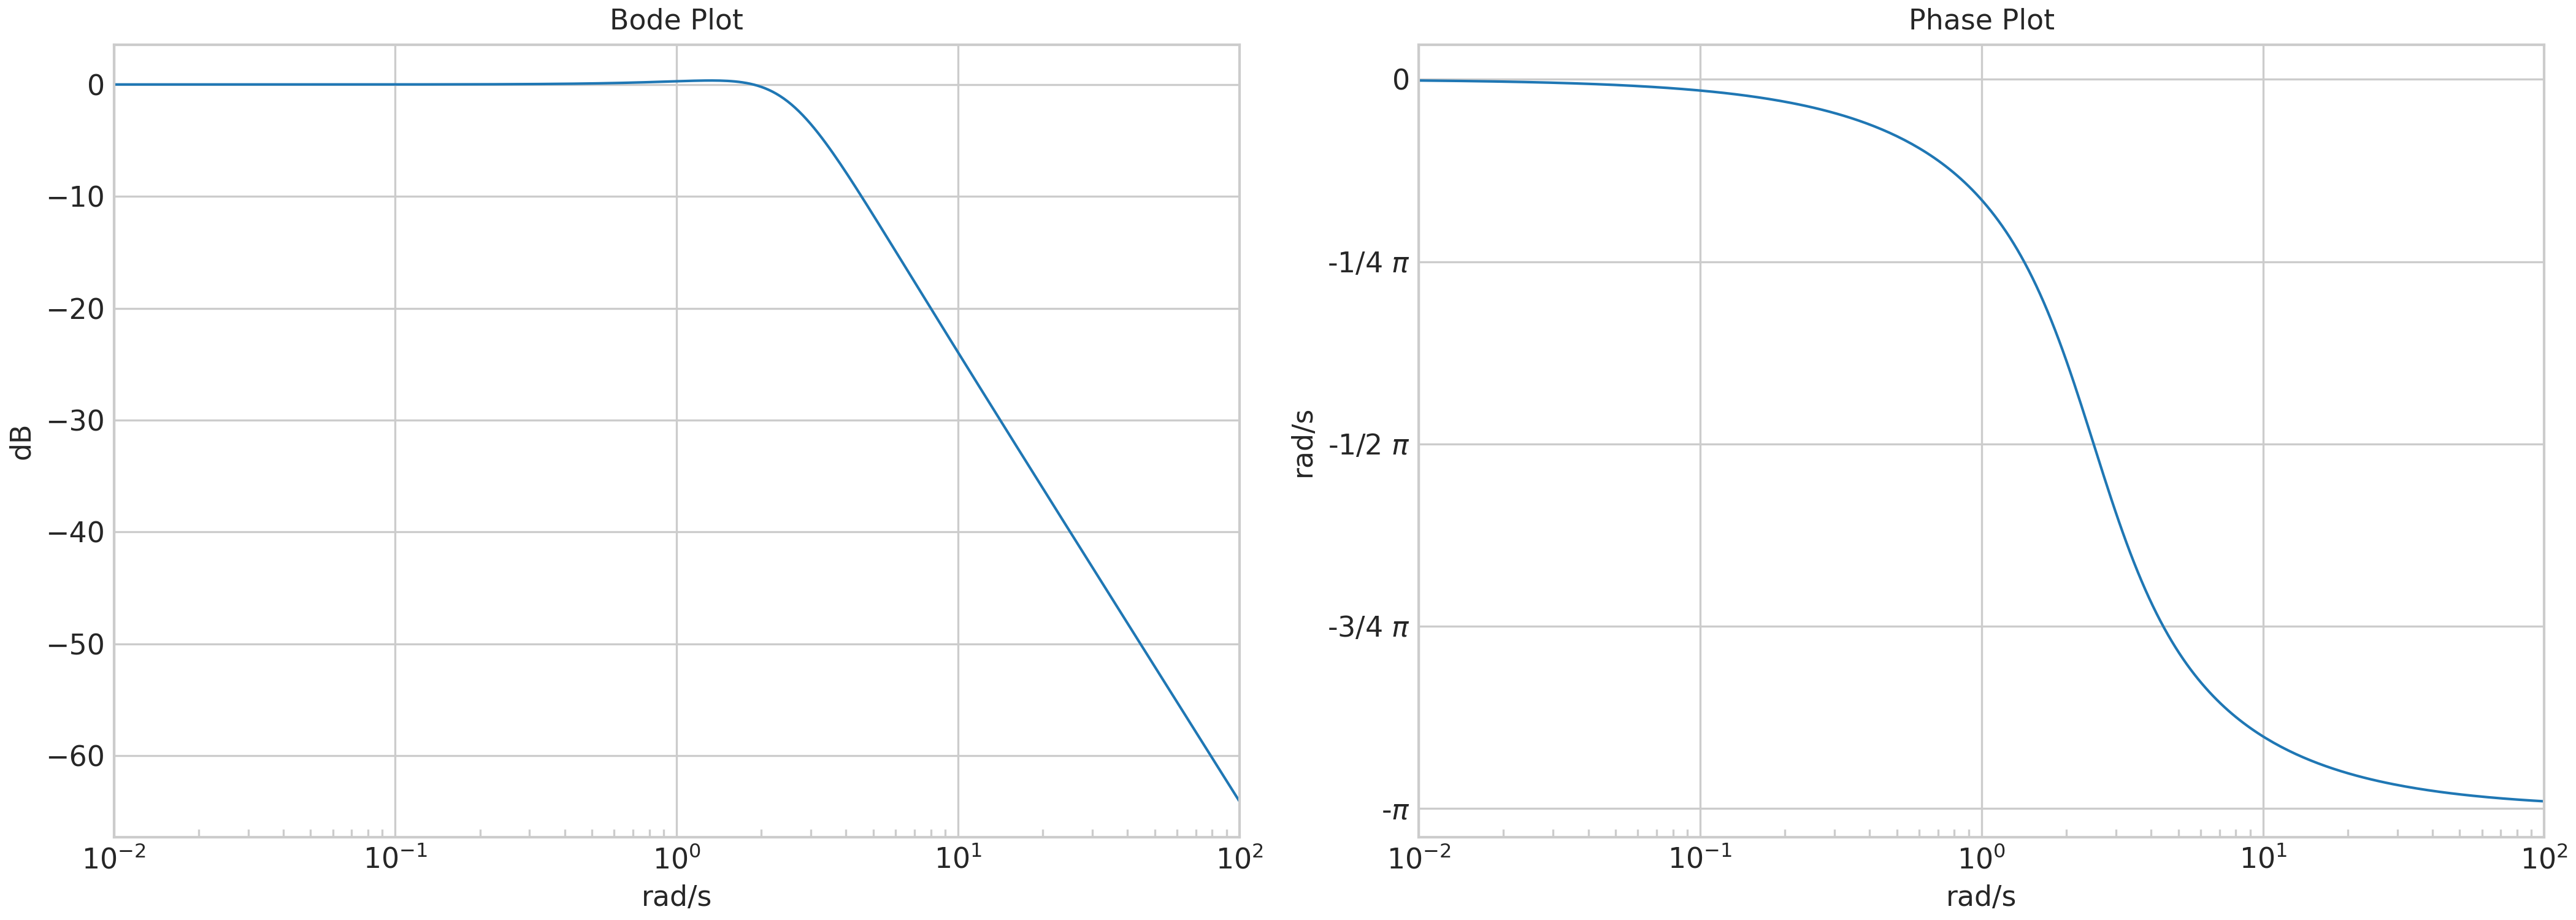
Minimum Example#
Demonstrates a short example of the core functionality of the sysplot module.
a Bode plot consisting of two subplots
phase unwrapped in multiples of \(2\pi\)
phase tick labels displayed as fractional multiples of \(\frac{\pi}{2}\)
magnitude displayed in dB
logarithmic frequency axis
minor ticks at every decade of the frequency axis
consistent figure styling based on a configurable seaborn-derived theme
import numpy as np
import matplotlib.pyplot as plt
import control as ctrl
import sysplot as ssp

ssp.apply_config()  # apply sysplot style

# Generate frequency response
omega = np.logspace(-2, 2, 300)
system = ctrl.tf([6.25], [1, 3, 6.25])
mag, phase, _ = ctrl.frequency_response(system, omega)

fig, axes = ssp.plot_bode(mag, phase, omega)  # ** sysplot is used here **

axes[0].set(xlabel="rad/s", ylabel="dB", title="Bode Plot")
axes[1].set(xlabel="rad/s", ylabel="rad/s", title="Phase Plot")
plt.show()
Total running time of the script: (0 minutes 1.007 seconds)