
Note
Go to the end to download the full example code.
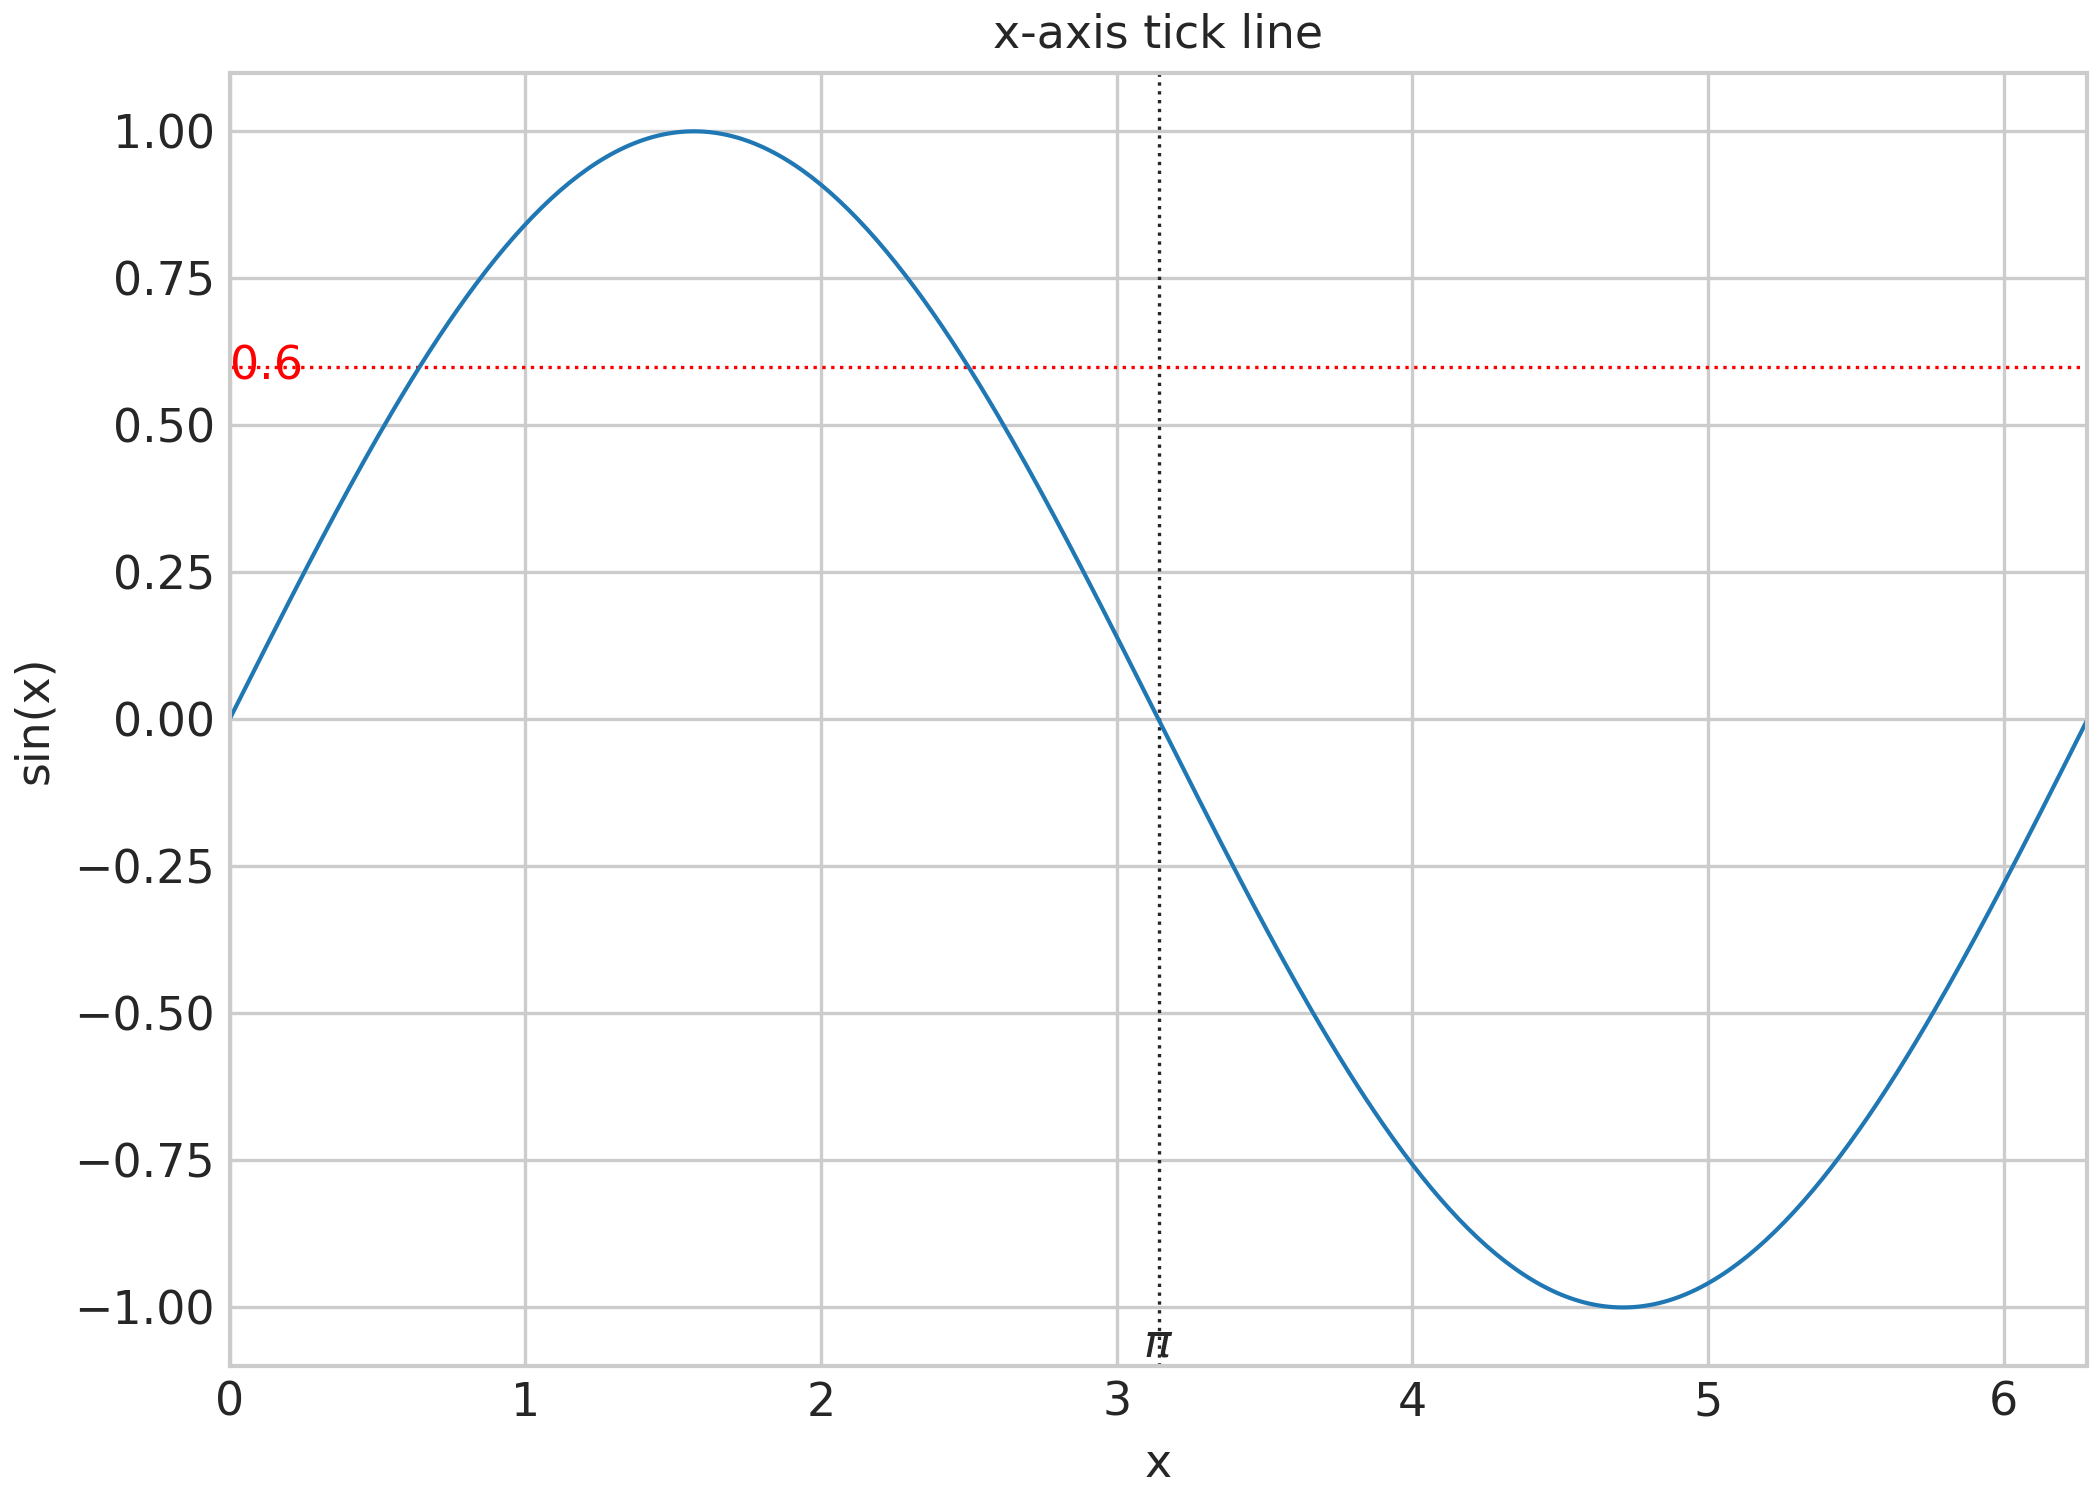
Add Tick Line#
sysplot.add_tick_line() draws a dotted reference line and a text label
at a specific axis value without modifying the existing major tick locator.
It works on both x- and y-axes and supports both linear and logarithmic scales.
import numpy as np
import matplotlib.pyplot as plt
import sysplot as ssp

ssp.apply_config()

x = np.linspace(0, 2 * np.pi, 400)

fig, ax = plt.subplots()

ax.plot(x, np.sin(x))
ax.set(title="x-axis tick line", xlabel="x", ylabel="sin(x)")

ssp.add_tick_line(value=np.pi, label=r"$\pi$", axis=ax.xaxis)
ssp.add_tick_line(value=0.6, label="0.6", axis=ax.yaxis, color="red")

plt.show()
Total running time of the script: (0 minutes 0.286 seconds)