
Note
Go to the end to download the full example code.
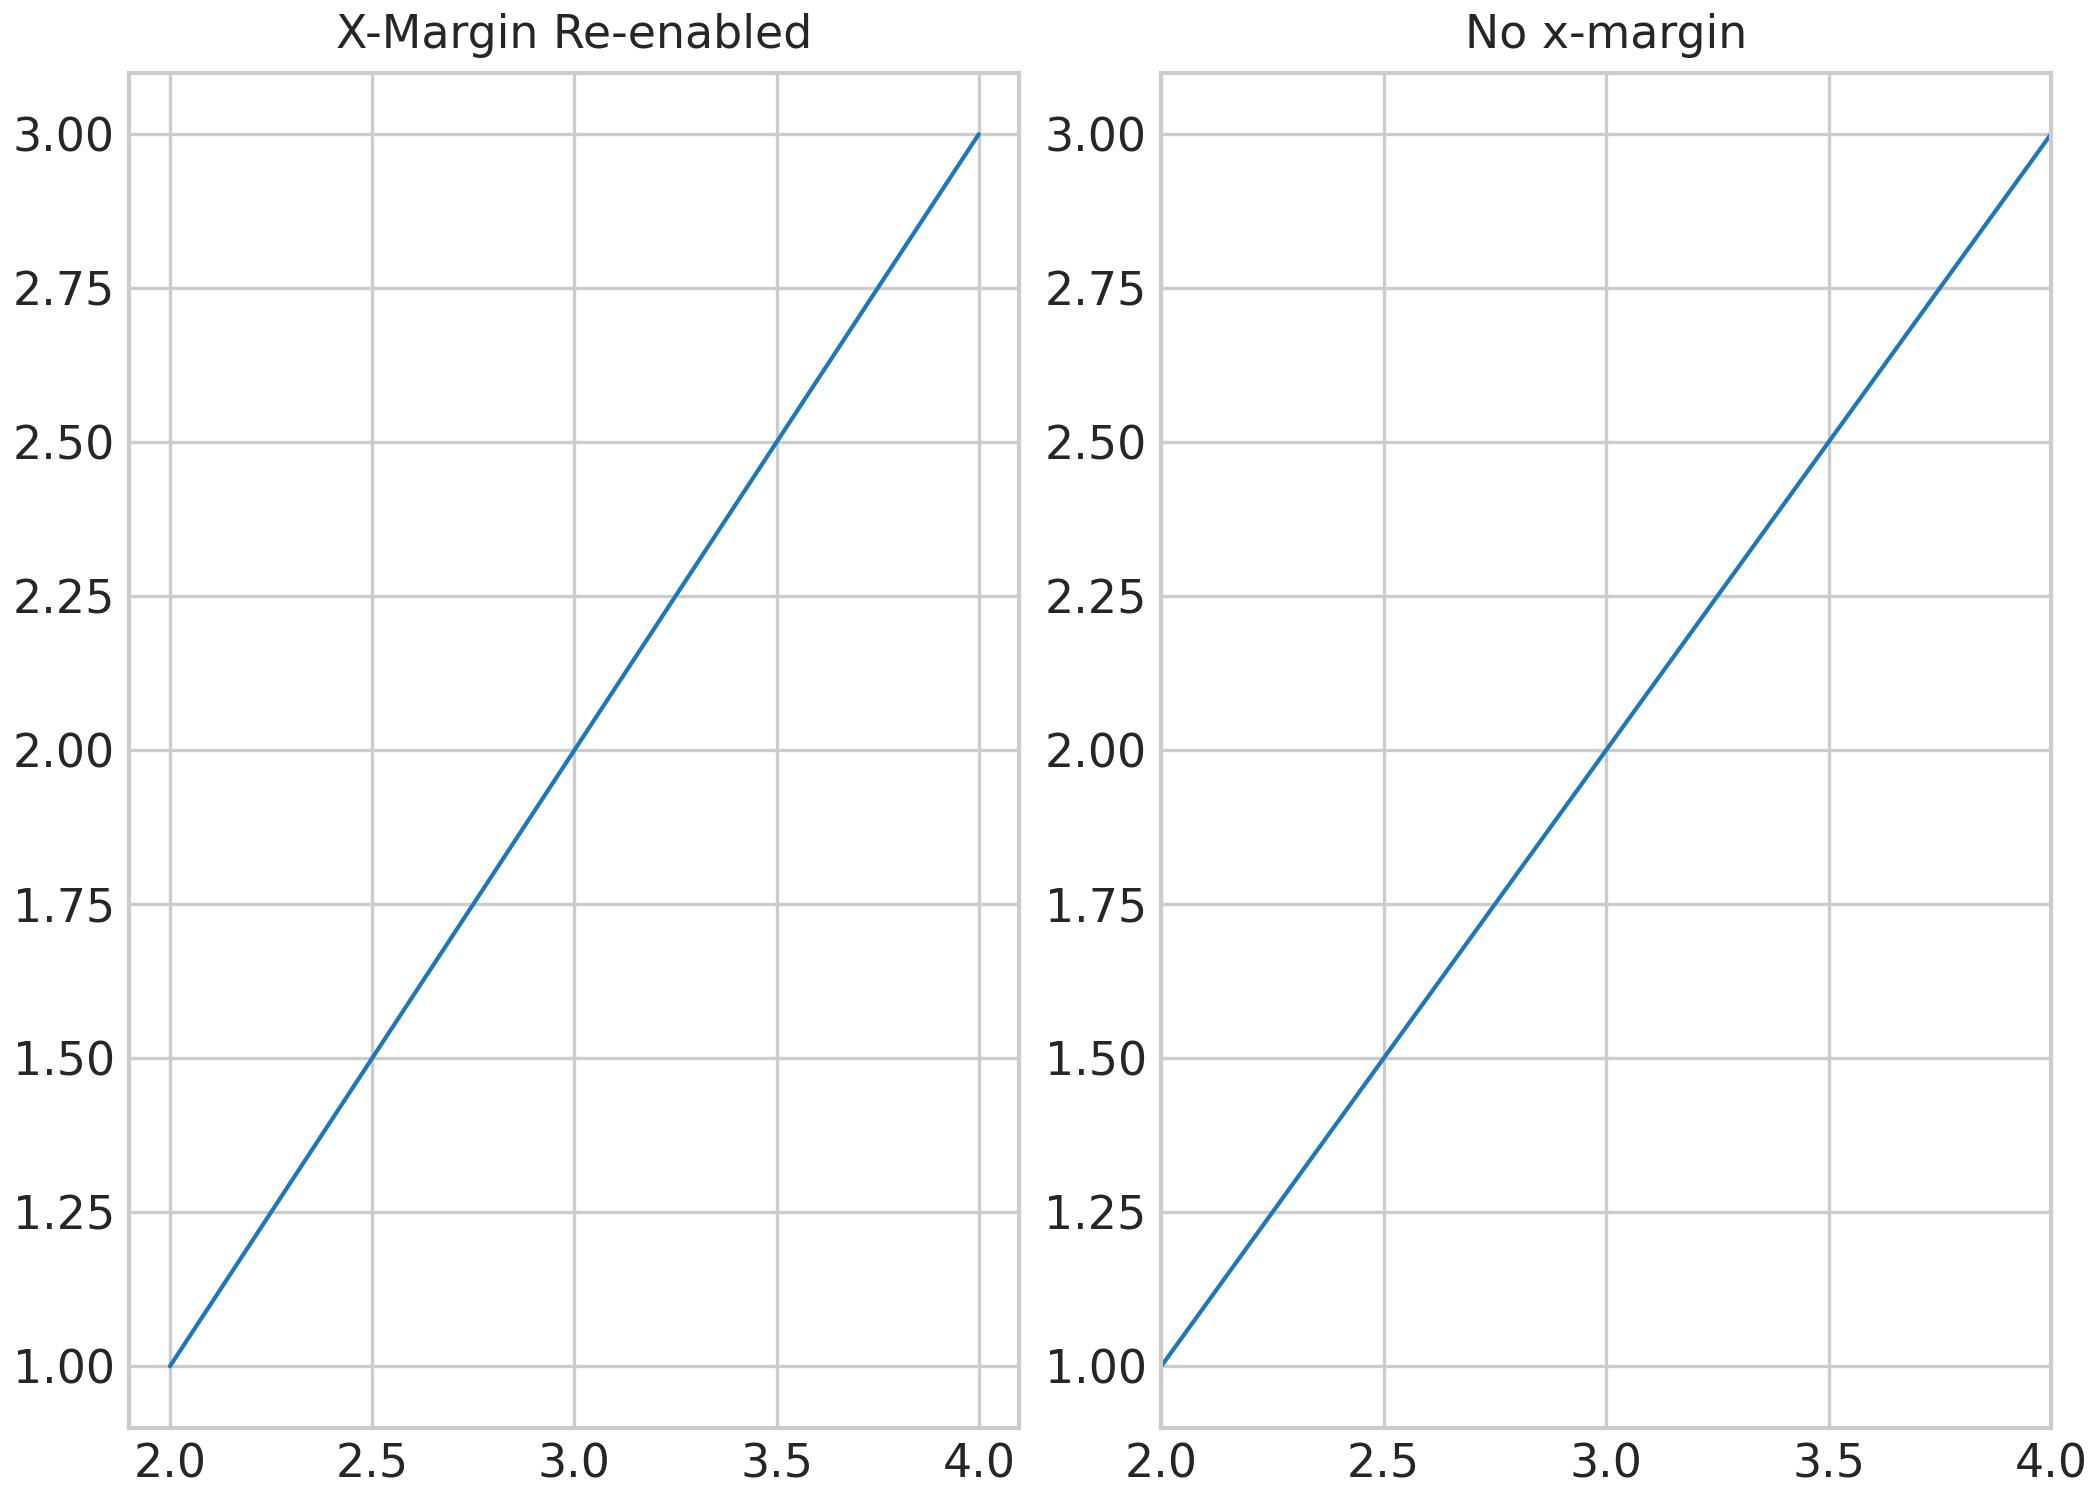
X-Margin Example#
sysplot.apply_config() sets the x-margin to zero by default so that
data fills the full axis width. sysplot.set_xmargin() re-enables
horizontal padding on individual axes when whitespace around the data is
preferred.
import matplotlib.pyplot as plt
import sysplot as ssp

ssp.apply_config()

fig, axes = plt.subplots(1, 2)

# reenables x-axis margins around the data
ssp.set_xmargin(axes[0], use_margin=True)
axes[0].plot([2, 4], [1, 3])
axes[0].set_title("X-Margin Re-enabled")

axes[1].plot([2, 4], [1, 3])
axes[1].set_title("No x-margin")

plt.show()
Total running time of the script: (0 minutes 0.321 seconds)