Ctrl+K
sysplot 1.0.2 documentation - Home sysplot 1.0.2 documentation - Home
  • Getting Started
  • Example Gallery
  • Concepts
  • API Reference
  • Getting Started
  • Example Gallery
  • Concepts
  • API Reference

Section Navigation

  • Emphasize Coordinate Lines Example
  • Add Origin Example
  • Heaviside Step Function
  • X-Margin Example
  • Plot Unit Circle
  • Repeat Axis Ticks Example
  • Add Tick Line
  • Minimum Example
  • Zorder Example
  • Plot Stem
  • Set Minor Log Ticks
  • Apply Config Example
  • Get Figure Size
  • Get Style Example
  • Plot Nyquist
  • Plot Poles and Zeros
  • Plot Bode
  • Set Major Ticks
  • Plot Filter Tolerance
  • Save Current Figure
  • Plot Angle Example
  • Matplotlib Cycler
  • Quick Start Example
  • Example Gallery

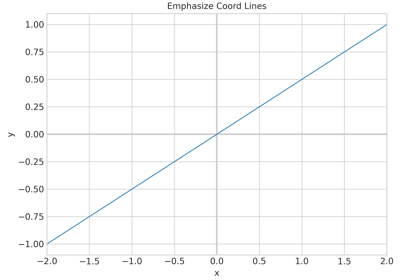
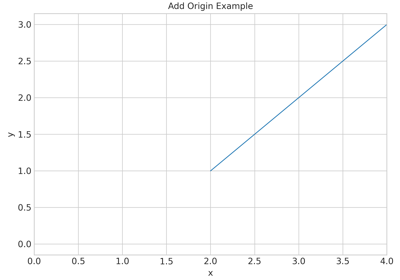
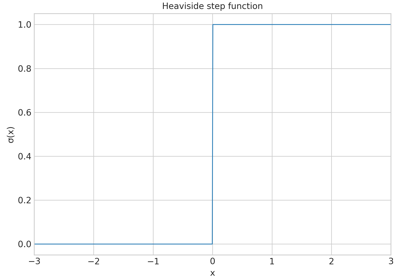
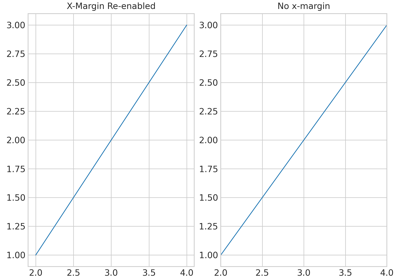
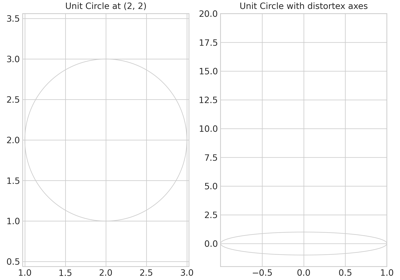
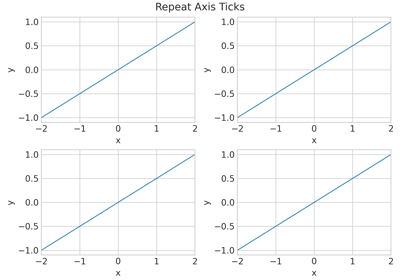
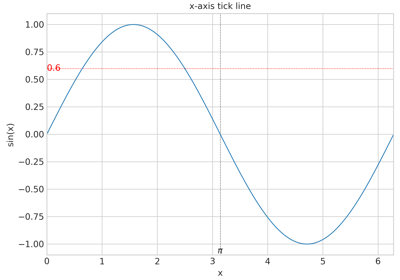
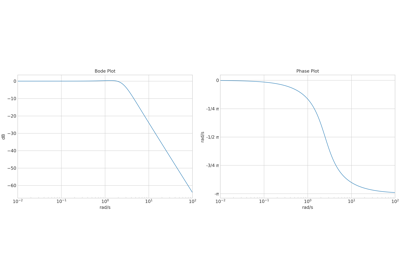
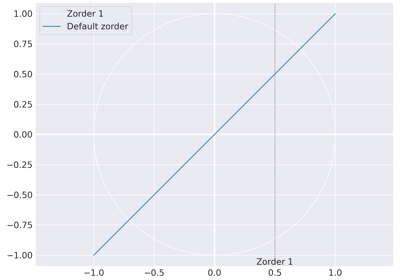
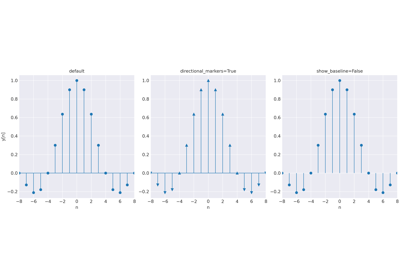
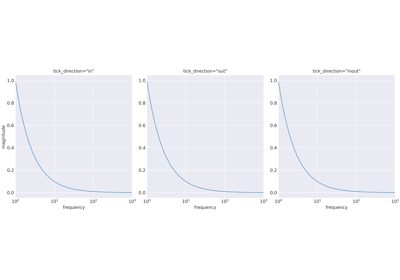
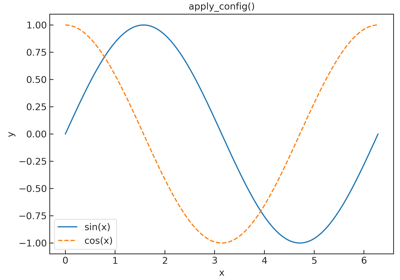
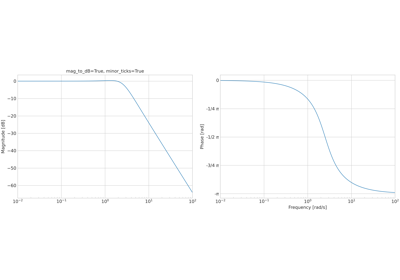
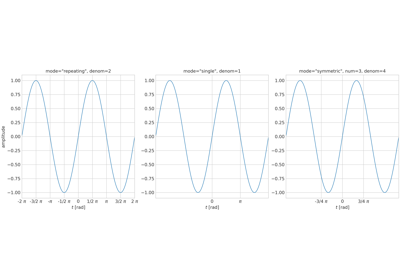
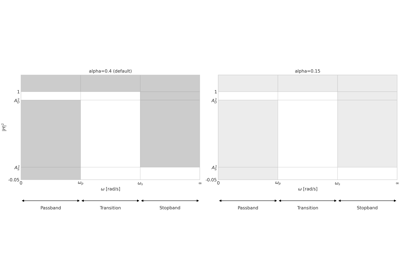
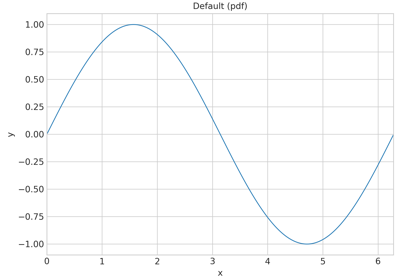
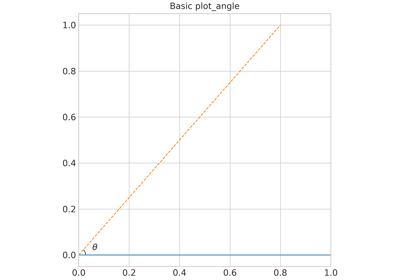
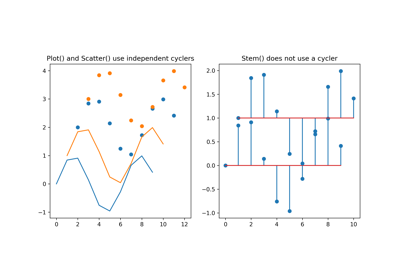
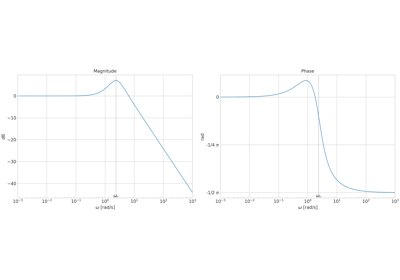
Example Gallery#

Below is a gallery of examples.

Emphasize Coordinate Lines Example

Emphasize Coordinate Lines Example

Add Origin Example

Add Origin Example

Heaviside Step Function

Heaviside Step Function

X-Margin Example

X-Margin Example

Plot Unit Circle

Plot Unit Circle

Repeat Axis Ticks Example

Repeat Axis Ticks Example

Add Tick Line

Add Tick Line

Minimum Example

Minimum Example

Zorder Example

Zorder Example

Plot Stem

Plot Stem

Set Minor Log Ticks

Set Minor Log Ticks

Apply Config Example

Apply Config Example

Get Figure Size

Get Figure Size

Get Style Example

Get Style Example

Plot Nyquist

Plot Nyquist

Plot Poles and Zeros

Plot Poles and Zeros

Plot Bode

Plot Bode

Set Major Ticks

Set Major Ticks

Plot Filter Tolerance

Plot Filter Tolerance

Save Current Figure

Save Current Figure

Plot Angle Example

Plot Angle Example

Matplotlib Cycler

Matplotlib Cycler

Quick Start Example

Quick Start Example

Download all examples in Python source code: _auto_examples_python.zip

Download all examples in Jupyter notebooks: _auto_examples_jupyter.zip

Gallery generated by Sphinx-Gallery

previous

Getting Started

next

Emphasize Coordinate Lines Example

This Page

  • Show Source

© Copyright 2026, Jan Hoegen.

Created using Sphinx 9.1.0.

Built with the PyData Sphinx Theme 0.16.1.