
Note
Go to the end to download the full example code.
Add Origin Example#
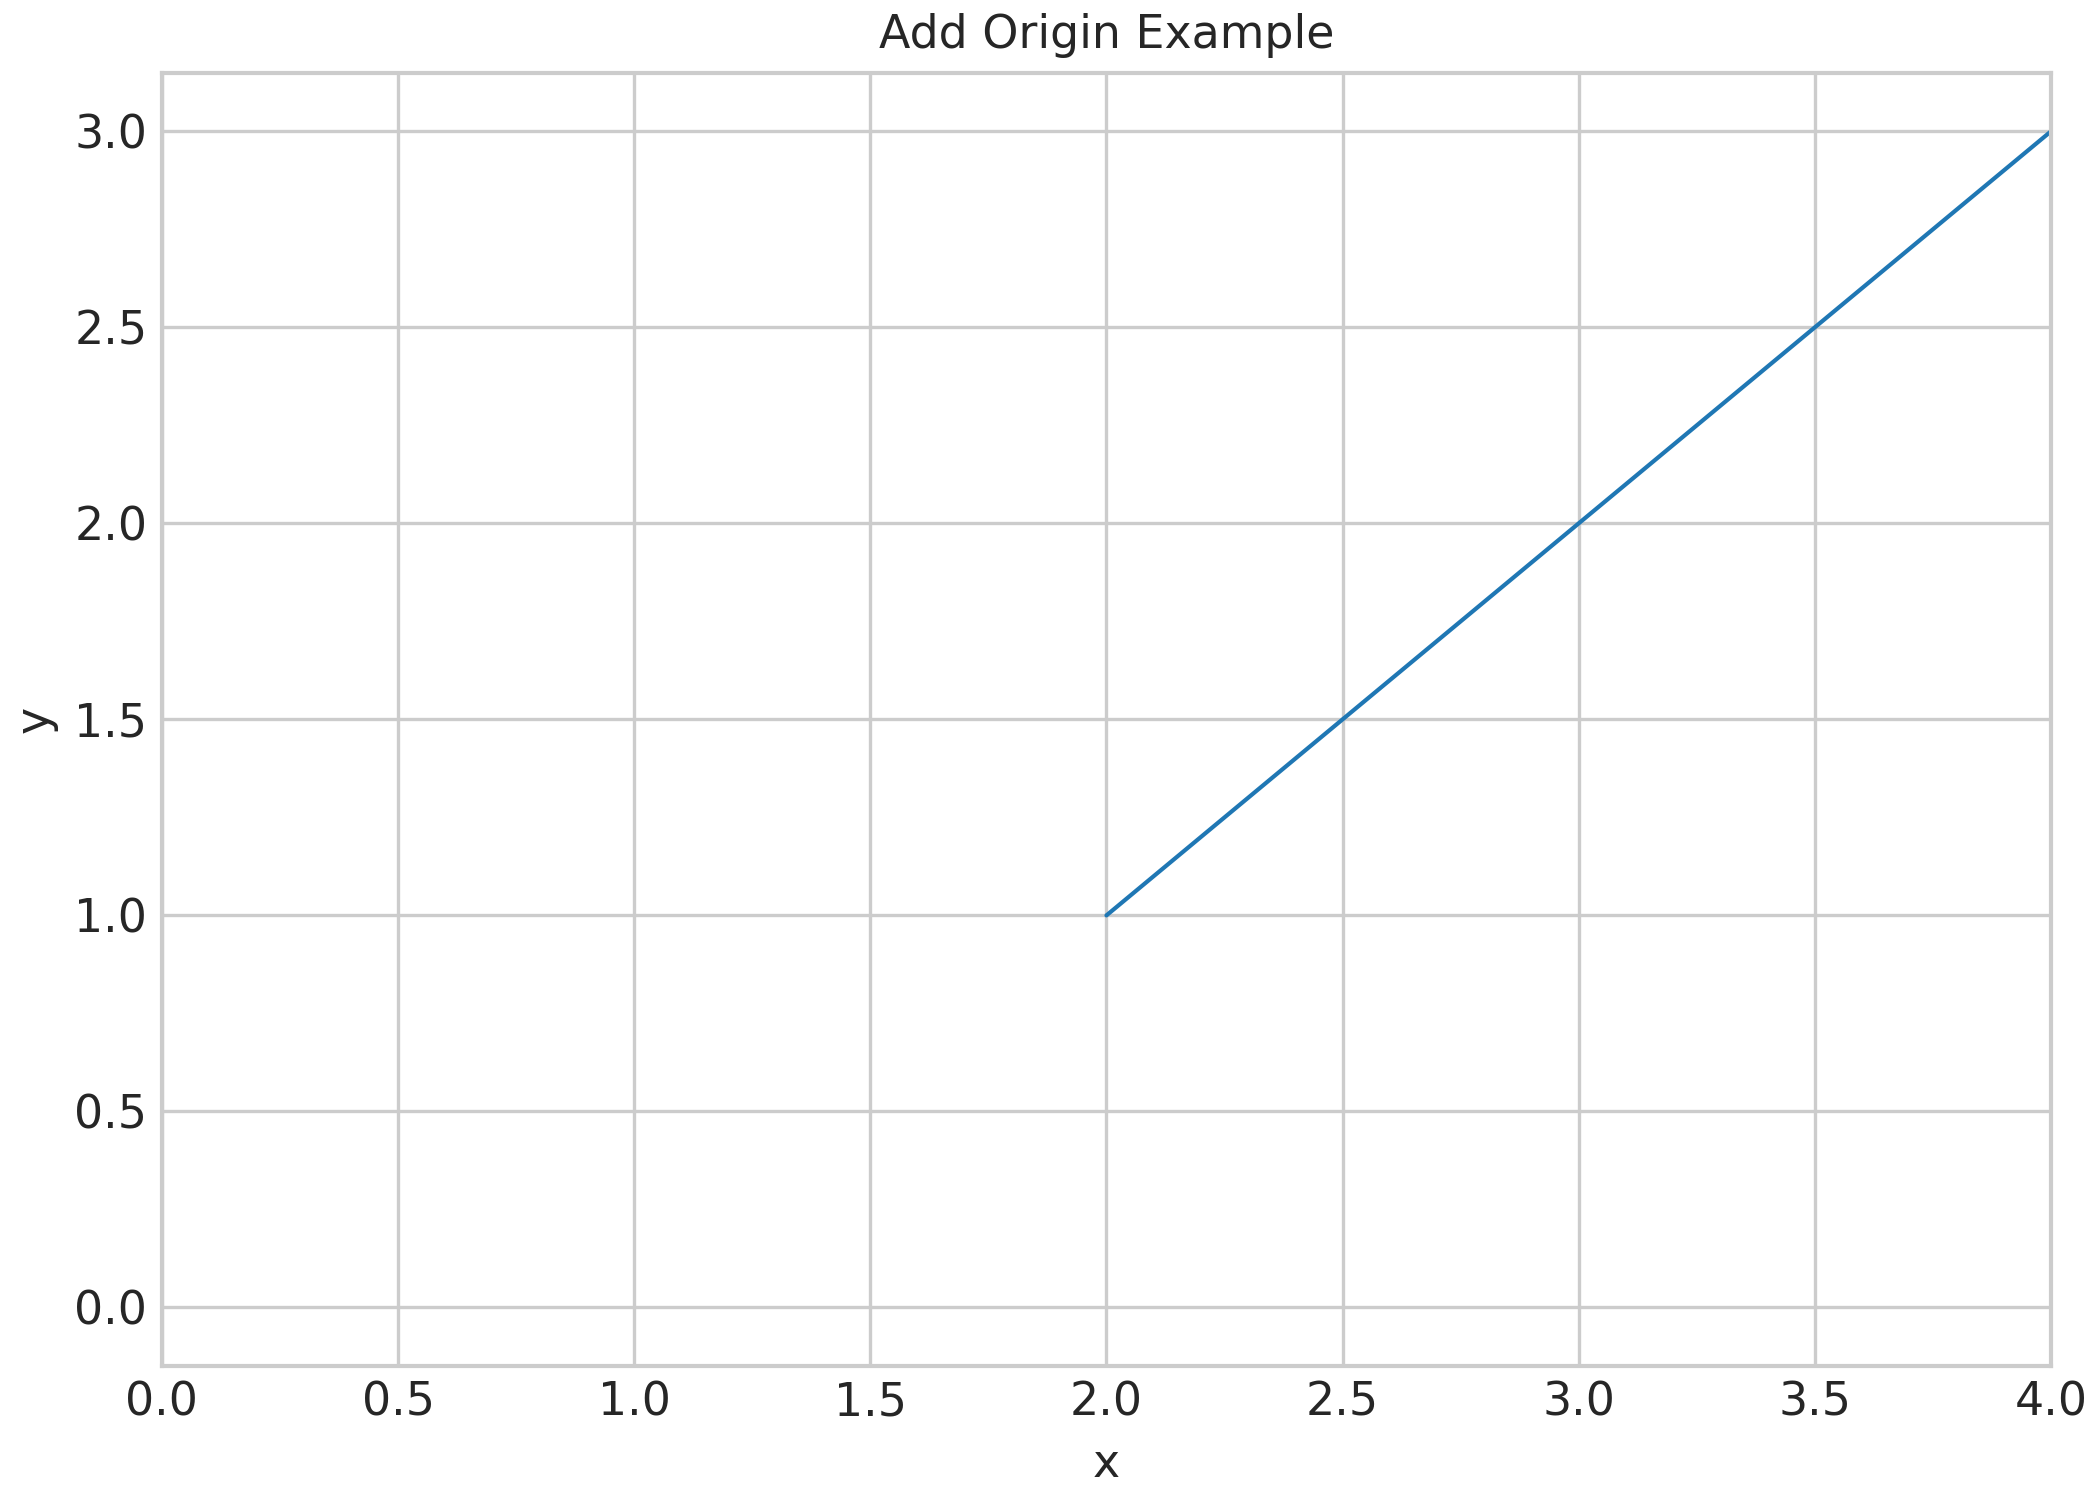
sysplot.add_origin() forces the point (0, 0) to be included in the plot view, even when no data passes through the origin.
import matplotlib.pyplot as plt
import sysplot as ssp

ssp.apply_config()

fig, ax = plt.subplots()

# makes the origin (0,0) visible in the plot even if no data points are plotted there
ssp.add_origin(ax)

plt.plot([2, 4], [1, 3])

ax.set(title="Add Origin Example", xlabel="x", ylabel="y")

plt.show()
Total running time of the script: (0 minutes 0.227 seconds)