
Note
Go to the end to download the full example code.
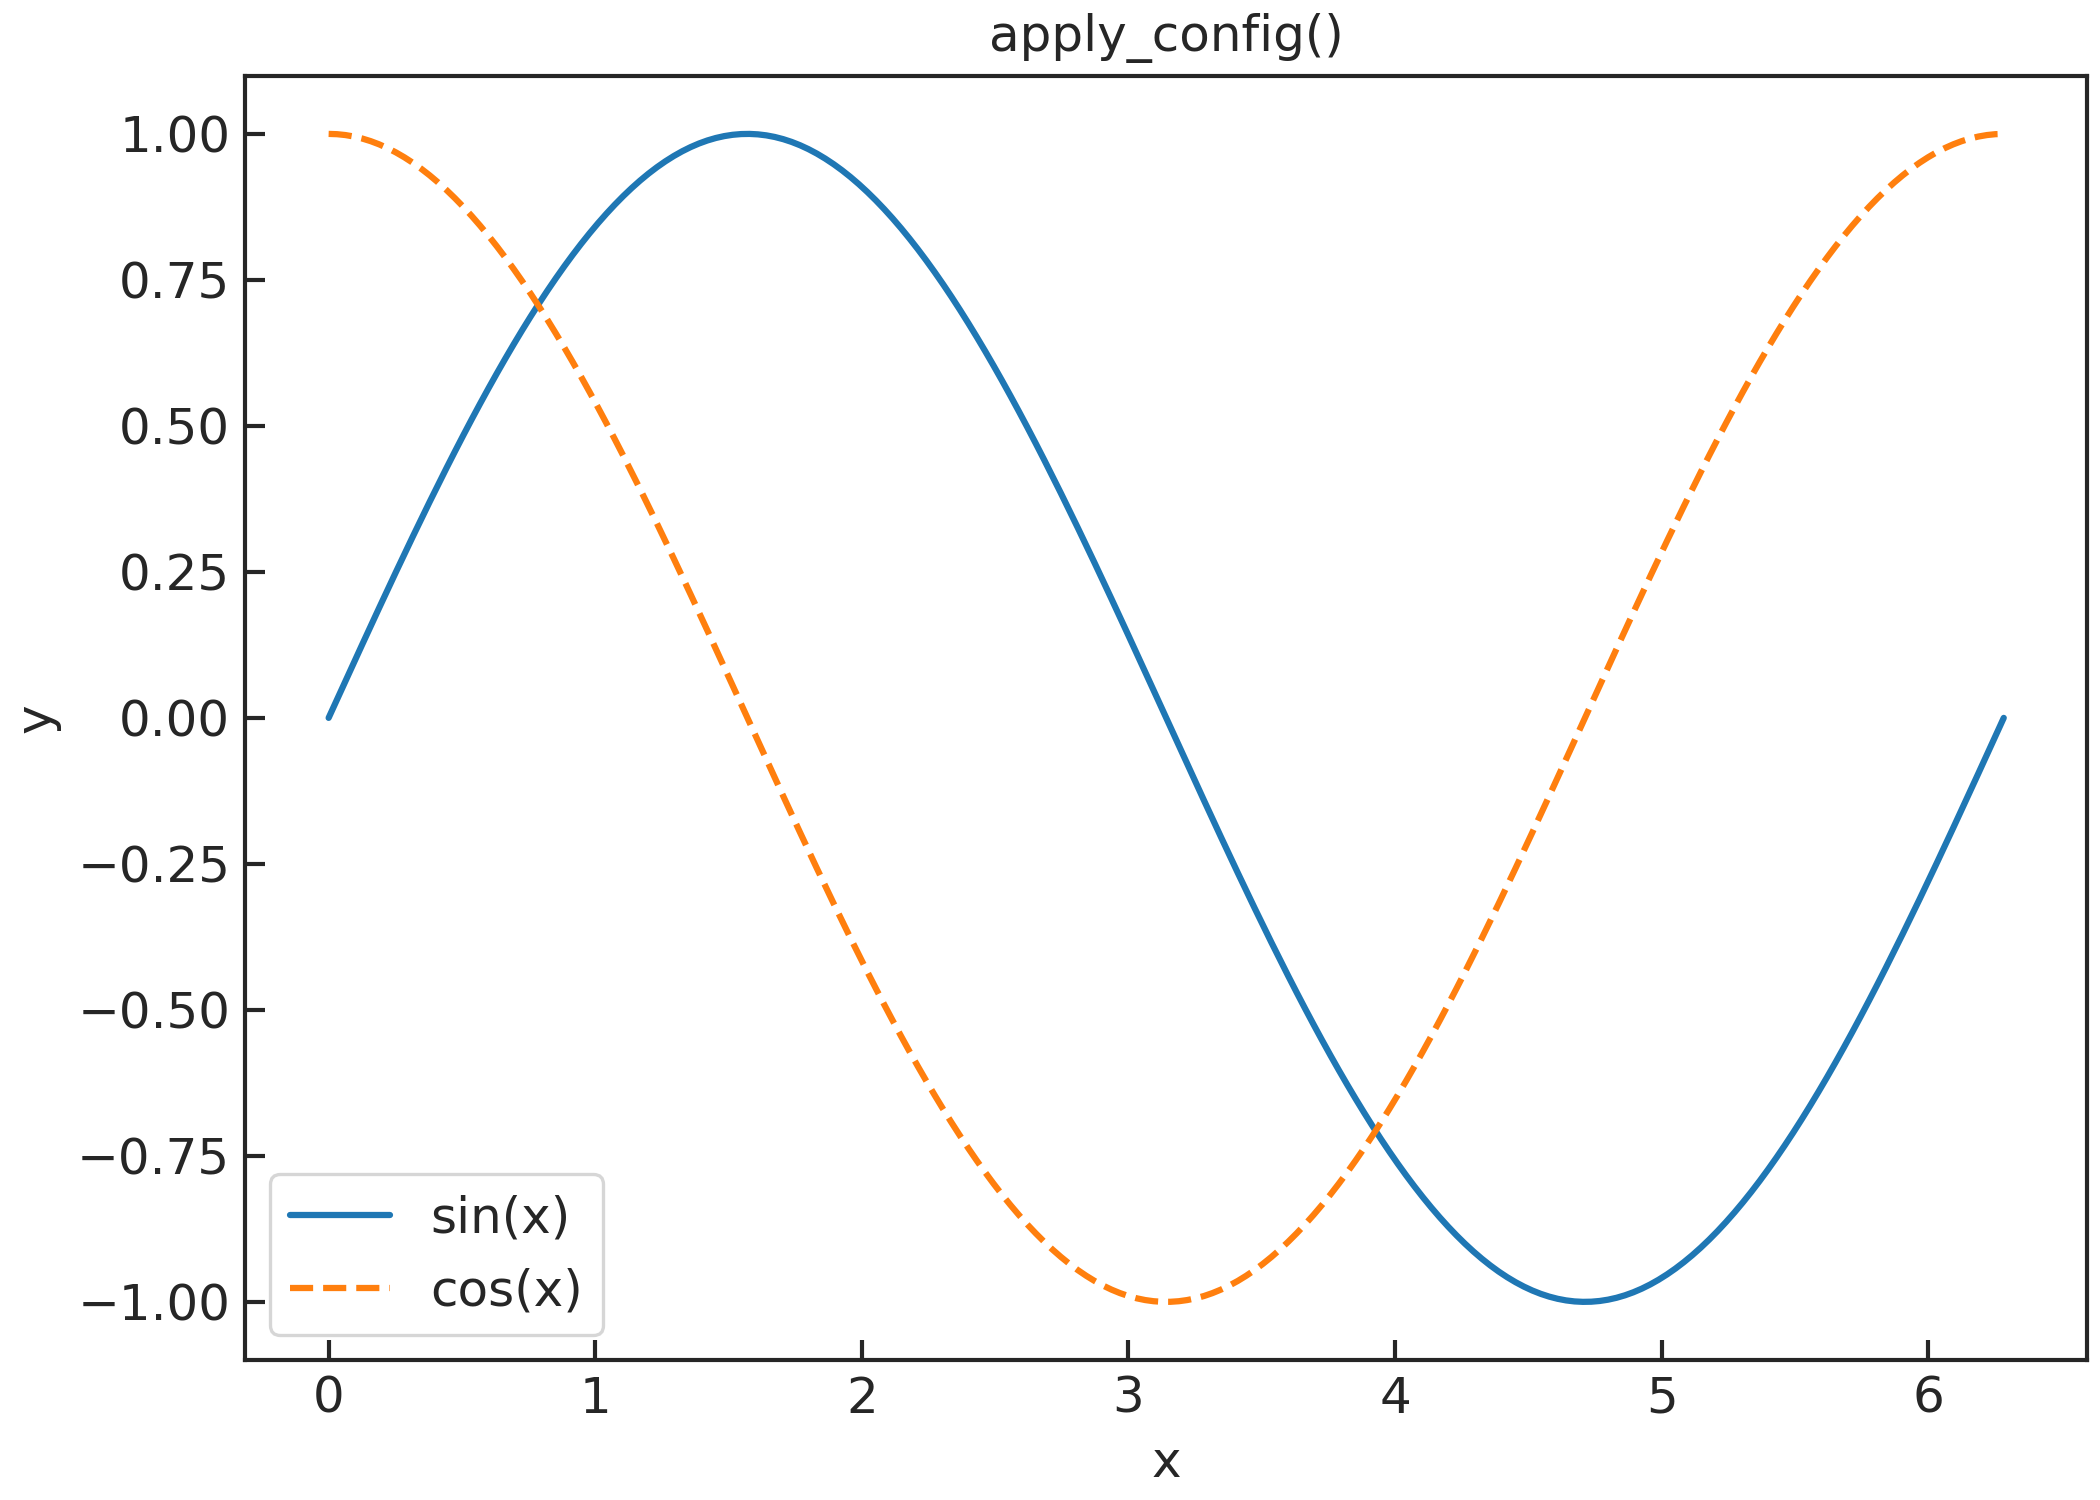
Apply Config Example#
sysplot.apply_config() applies a seaborn-derived theme globally to all
subsequent Matplotlib figures. Font size, line width, x-margin, and seaborn
style can be customised via sysplot.SysplotConfig, overridden
individually, or reset to defaults with sysplot.reset_config().
active font_size: 12
active xmargin: 0.05
import matplotlib.pyplot as plt
import numpy as np
import sysplot as ssp

# Create and validate a custom configuration.
config = ssp.SysplotConfig(font_size=12, linewidth=1.5, seaborn_style="ticks")
config.validate()

# Apply the full config object.
ssp.apply_config(config=config)

# You can still override selected fields directly.
ssp.apply_config(xmargin=0.05)

# Inspect active values.
current = ssp.get_config()
print("active font_size:", current.font_size)
print("active xmargin:", current.xmargin)

x = np.linspace(0, 2 * np.pi, 200)
fig, ax = plt.subplots()
ax.plot(x, np.sin(x), label="sin(x)")
ax.plot(x, np.cos(x), label="cos(x)")
ax.set(title="apply_config()", xlabel="x", ylabel="y")
ax.legend()
plt.show()

# Optionally restore defaults for later plots.
ssp.reset_config()
Total running time of the script: (0 minutes 0.241 seconds)