
Note
Go to the end to download the full example code.
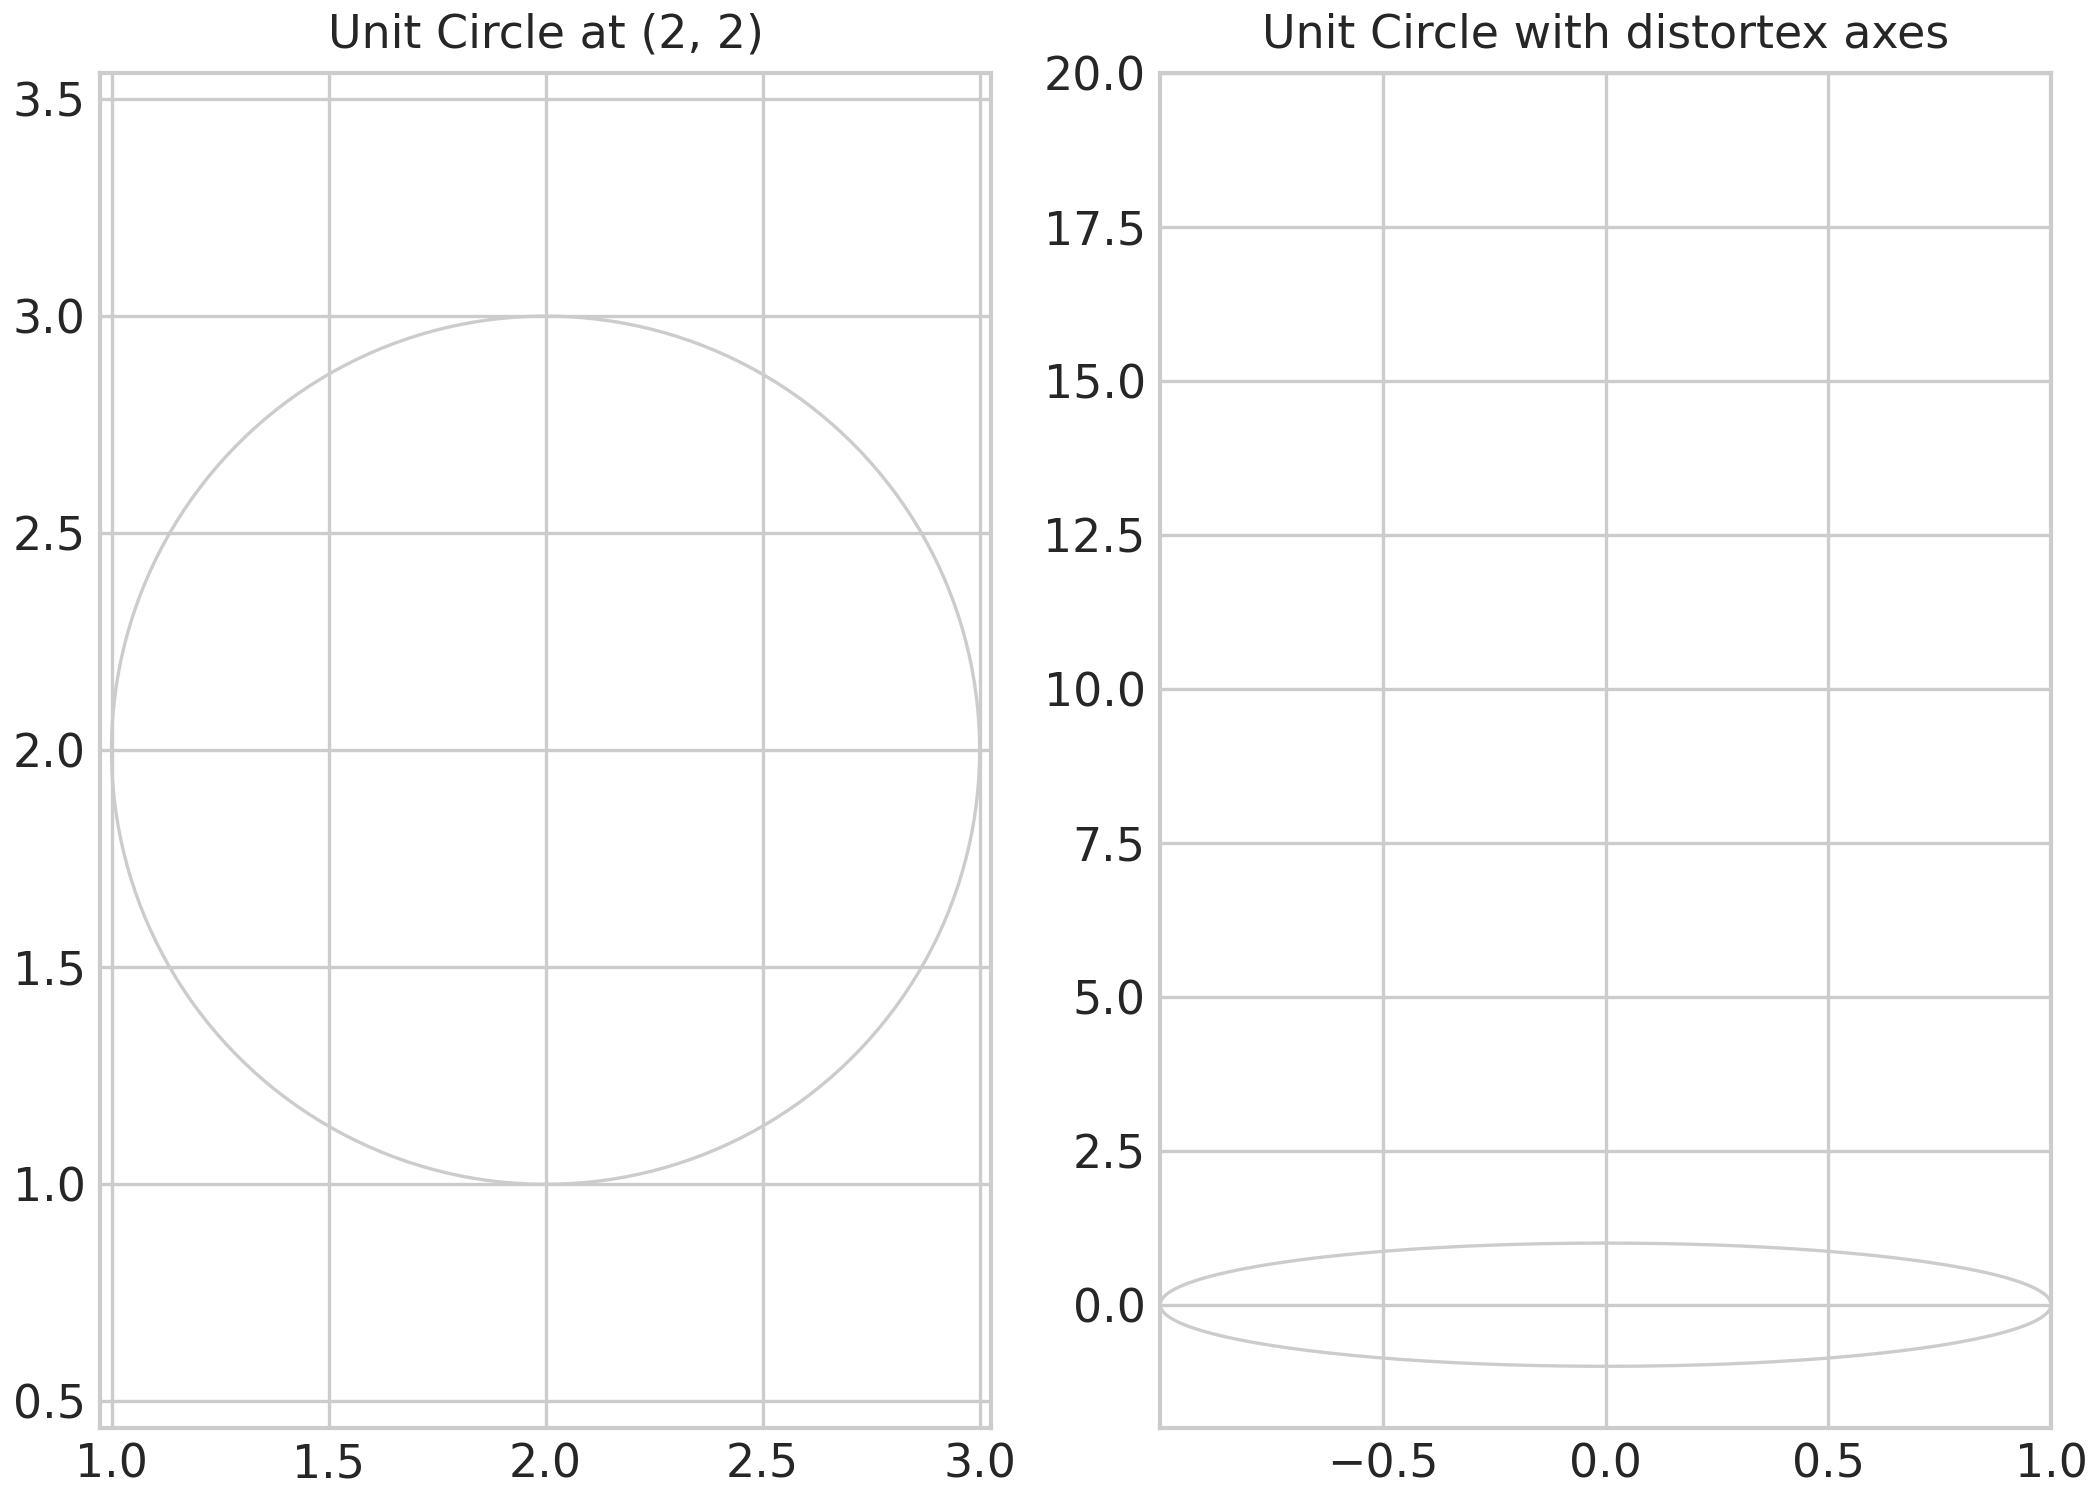
Plot Unit Circle#
sysplot.plot_unit_circle() draws a circle of radius 1 centered at a
given origin. Line color, style, and width default to the grid style from
Matplotlib’s rcParams. Combined with sysplot.plot_poles_zeros(), it
provides the standard stability boundary for discrete-time pole-zero maps.
import matplotlib.pyplot as plt
import sysplot as ssp

ssp.apply_config()

fig, ax = plt.subplots(1, 2)

ssp.plot_unit_circle(
    ax=ax[0],
    origin=(2, 2),
)
ax[0].set(title="Unit Circle at (2, 2)")

ax[1].set_ylim(-2, 20)
ssp.plot_unit_circle(ax=ax[1], equal_axes=False)
ax[1].set(title="Unit Circle with distortex axes")

plt.show()
Total running time of the script: (0 minutes 0.305 seconds)