sysplot.plot_unit_circle#
- plot_unit_circle(ax=None, origin=(0.0, 0.0), equal_axes=True, **kwargs)[source]#
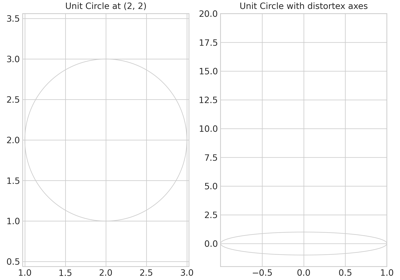
Draw a unit circle on the axes.
Draws a circle of radius 1 centered at
origin. Line color, style, and width default to the grid style from Matplotlib’s rcParams.- Parameters:
ax (
Axes|None) – Axes to draw on. Defaults to the current axes.origin (
tuple[float,float]) – Center of the circle as(x, y). Default is(0, 0).equal_axes (
bool) – IfTrue, sets equal axis scaling so the circle appears round. Default isTrue.**kwargs –
Additional keyword arguments forwarded to
matplotlib.axes.Axes.plot().If
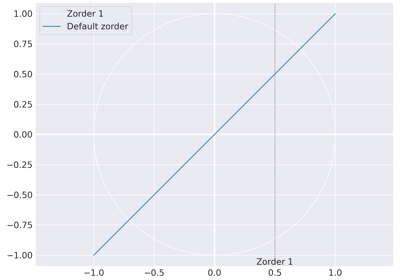
color,linestyle,linewidth, orzorderare not provided, they default torcParamsgrid settings andzorder_grid.
- Return type:
None
Examples using
sysplot.plot_unit_circle#- rtype:
None