sysplot.plot_bode#
- plot_bode(mag, phase, omega, axes=None, label=None, mag_to_dB=True, minor_ticks=True, tick_denominator=4, tick_numerator=1, x_to_log=True, phase_is_rad=True, **kwargs)[source]#
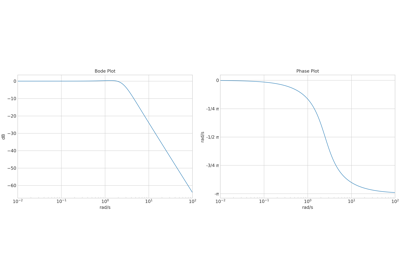
Plot a two-panel Bode magnitude and phase diagram.
Creates magnitude and phase subplots from frequency response arrays. Phase is unwrapped with
numpy.unwrapfor continuous display across ±π boundaries and labelled as multiples of π-fractions whenphase_is_rad=True.Note
To show phase in degrees, pass
np.degrees(phase)and setphase_is_rad=False.- Parameters:
mag – Magnitude response values
|H(jω)|.phase – Phase response in radians (or degrees when
phase_is_rad=False).omega – Frequency vector in rad/s.
axes (
Axes|Sequence[Axes] |ndarray|None) – Two Axes for[magnitude, phase]subplots. IfNone, creates a new 1×2 figure.label (
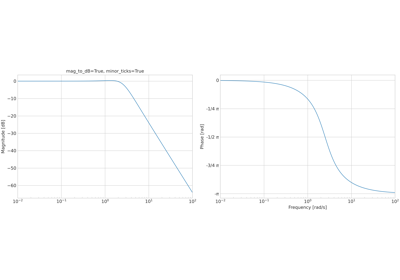
str|None) – Legend label for both subplots.mag_to_dB (
bool) – IfTrue, plots magnitude in dB (20·log₁₀).minor_ticks (
bool) – IfTrue, adds log-scale minor ticks to the frequency axis.tick_denominator (
int) – Denominator for π-based phase tick fractions (e.g.,4gives π/4 increments). Default is4.tick_numerator (
int) – Numerator for π-based phase tick fractions. Default is1.x_to_log (
bool) – IfTrue, uses a logarithmic frequency axis.phase_is_rad (
bool) – IfTrue, labels the phase axis in multiples of π. IfFalse, the axis uses default numeric labels.**kwargs –
Additional keyword arguments forwarded to
matplotlib.axes.Axes.plot()for both magnitude and phase curves.If
colororlinestyleare not provided, they are taken from the active sysplot style cycler. Passing either key inkwargsoverrides the cycler value for both subplots.
- Return type:
tuple[Figure,ndarray]- Returns:
tuple[Figure, np.ndarray] –
(fig, axes)whereaxesis[magnitude_ax, phase_ax]. Ifaxeswas provided, returns that same figure and axes.
Examples using
sysplot.plot_bode#