sysplot.plot_stem#
- plot_stem(x, y, ax=None, label=None, bottom=0.0, marker='o', markersize=None, show_baseline=True, directional_markers=False, continous_baseline=False, **kwargs)[source]#
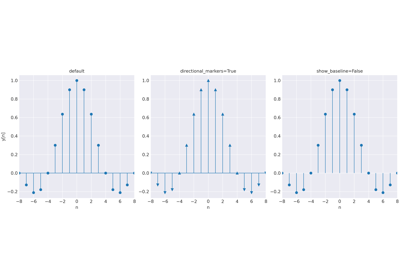
Plot vertical stems with optional outward-pointing markers.
Wraps
Axes.stemwith automatic style cycling. Whendirectional_markers=True, stems abovebottomusemarkerand stems below use its directional opposite fromFLIPPED_MARKERS(e.g.,^becomesv).Note
Use
marker="^"together withdirectional_markers=Trueto get outward-pointing arrows on both sides of the baseline.- Parameters:
x (
ndarray) – X-coordinates of the stems.y (
ndarray) – Y-values. Must have the same length asx.ax (
Axes|None) – Axes to plot on. Defaults to the current axes.label (
str|None) – Legend label. Applied to the above-baseline stems only.marker (
str) – Matplotlib marker style for stems at or abovebottom.bottom (
float) – Baseline value. Default is0.markersize (
float|None) – Marker size. Defaults tomarkersize.show_baseline (
bool) – IfTrue, draw and style the baseline.directional_markers (
bool) – IfTrue, flip the marker for stems belowbottom. Requiresmarkerto be inFLIPPED_MARKERS.continous_baseline (
bool) – IfTrue, draw extend the baseline withaxhline. Requiresshow_baseline=True.**kwargs –
Additional keyword arguments forwarded to
matplotlib.axes.Axes.stem().If
colororlinestyleare not provided, they are taken from the active sysplot style cycler and applied consistently to markers, stem lines, and baseline.
- Return type:
tuple[list,list,list]- Returns:
Tuple of
(markerlines, stemlines, baselines)— each a list of 1 or 2 objects depending on whetherdirectional_markerswas used.
Examples using
sysplot.plot_stem#