sysplot.set_minor_log_ticks#
- set_minor_log_ticks(axis=None, tick_direction=None, base=10.0, **kwargs)[source]#
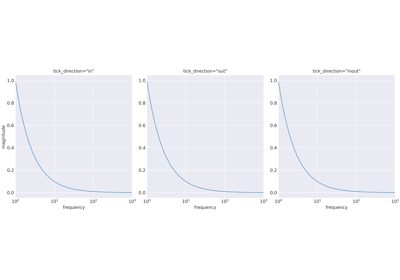
Add unlabeled minor ticks between decades of a logarithmic axis and styles them to match the grid color.
Note
Minor ticks are always placed at decade intervals, regardless of where the major ticks fall.
- Parameters:
axis (
XAxis|YAxis|None) – Axis to modify. Defaults to the current x-axis.tick_direction (
Optional[Literal['in','out','inout']]) – Direction of minor ticks. Defaults totick_direction.base (
float) – Logarithm base for the axis scale.**kwargs – Additional keyword arguments forwarded to
matplotlib.axes.Axes.tick_params()for minor ticks.
- Return type:
None
Examples using
sysplot.set_minor_log_ticks#- rtype:
None