sysplot.restore_tick_labels#
- restore_tick_labels(fig=None)[source]#
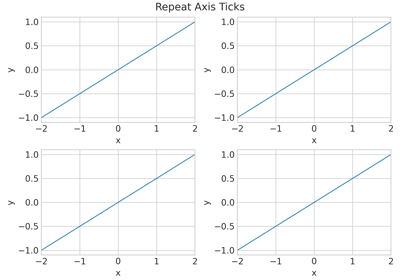
Show tick labels on all axes of a figure.
Useful when working with shared axes layouts where Matplotlib hides some tick labels by default. Instead of restoring the axis labels one by one, this function applies the necessary tick parameters to every axes in the figure so that all tick labels are visible.
- Parameters:
fig (
Figure|None) – Matplotlib figure to modify. IfNone, usesmatplotlib.pyplot.gcf().- Return type:
None
Examples using
sysplot.restore_tick_labels#- rtype:
None