sysplot.add_tick_line#
- add_tick_line(value, label, axis=None, offset=0.0, color=None, text_kw=None, **kwargs)[source]#
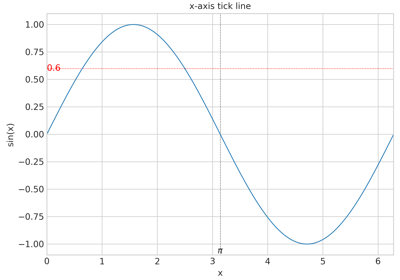
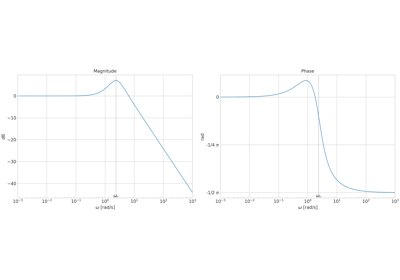
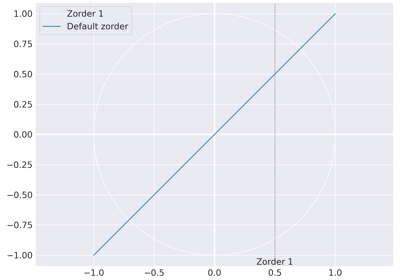
Draw a dotted reference line and label at a specific axis value.
Adds a labeled tick at
valuewithout modifying the existing major tick locator. Useful for highlighting key values such as resonance frequencies or time constants.- Parameters:
value (
float) – Tick position in data coordinates.label (
str) – Text to display at the tick.axis (
XAxis|YAxis|None) – Target axis (ax.xaxisorax.yaxis). Defaults to the current x-axis.offset (
float) – Fractional offset along the perpendicular axis for the label (axis coordinates). Negative values place the label below/left.color (
str|None) – Color of the reference line and label. IfNone, uses the default text color.text_kw (
dict|None) – Extra keyword arguments forwarded to the text annotation (e.g.fontsize,fontweight,color). Ifcoloris provided here, it is also used as the axvline and axhline color.**kwargs – Additional keyword arguments forwarded to
axhlineoraxvline(e.g.linewidth,linestyle,alpha,zorder).
- Return type:
None
Examples using
sysplot.add_tick_line#- rtype:
None