sysplot.emphasize_coord_lines#
- emphasize_coord_lines(fig=None, **kwargs)[source]#
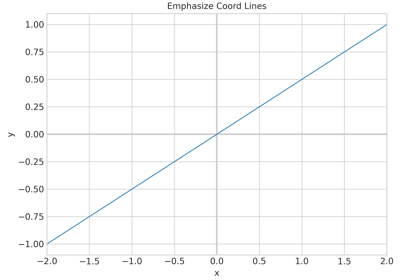
Draw coordinate axes lines at the origin on all 2D axes in a figure.
Adds one horizontal line at
y=0and one vertical line atx=0for every 2D axes in the target figure.- Parameters:
fig (
Figure|None) – Matplotlib figure to modify. IfNone, usesmatplotlib.pyplot.gcf().**kwargs –
Additional keyword arguments forwarded to
matplotlib.axes.Axes.axhline()andmatplotlib.axes.Axes.axvline().colorcontrols both coordinate lines unless overridden. If omitted, the default isrcParams["grid.color"].
- Return type:
None
Note
3D axes are not currently supported.
Examples using
sysplot.emphasize_coord_lines#