sysplot.plot_nyquist#
- plot_nyquist(real, imag, ax=None, label=None, mirror=True, arrow_position=None, alpha=None, equal_axes=True, arrow_size=None, **kwargs)[source]#
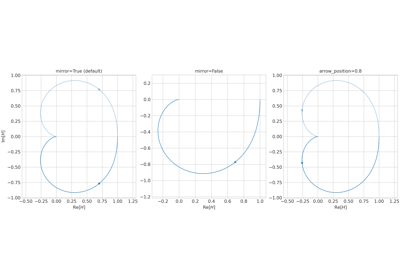
Plot a Nyquist diagram with a directional arrow and optional mirror curve.
Draws the frequency response in the complex plane. A directional arrow marks the direction of increasing frequency. The complex conjugate curve (mirror) is rendered at reduced opacity when
mirror=True.- Parameters:
real (
ndarray) – Real parts of the frequency responseH(jω).imag (
ndarray) – Imaginary parts of the frequency responseH(jω).ax (
Axes|None) – Axes to plot on. Defaults to the current axes.label (
str|None) – Legend label for the main curve.mirror (
bool) – IfTrue, also plots the complex conjugate curve.arrow_position (
float|None) – Fractional arc-length position (0–1) for the direction arrow. Defaults tonyquist_arrow_position.alpha (
float|None) – Transparency of the mirror curve. Defaults tonyquist_mirror_alpha.equal_axes (
bool) – IfTrue, sets equal axis scaling.arrow_size (
int|None) – Arrow head size (mutation_scale). Defaults tonyquist_arrow_size.**kwargs –
Additional keyword arguments forwarded to
matplotlib.axes.Axes.plot()for both the main and mirrored curves.If
colororlinestyleare not provided, they are taken from the active sysplot style cycler. The arrow color follows the resolved curve color.
- Return type:
None
Examples using
sysplot.plot_nyquist#- rtype:
None