sysplot.plot_angle#
- plot_angle(center, point1, point2, text, ax=None, size=75.0, unit='points', textposition='inside', color=None, text_kw=None, **kwargs)[source]#
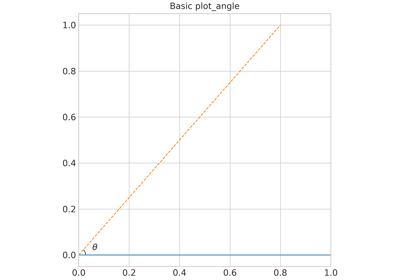
Draw and label the angle between two vectors.
The angle is formed by the vectors
center -> point1andcenter -> point2. The visible arc is always circular in display space, and its diameter is controlled bysize/unit.This function is a thin wrapper around Matplotlib’s angle-annotation approach: https://matplotlib.org/stable/gallery/text_labels_and_annotations/angle_annotation.html
Note
Reversing
point1andpoint2swaps the direction of the measured arc (useful to show the complementary/outer arc).- Parameters:
center (
Sequence[float]) – Arc center(x, y)in data coordinates.point1 (
Sequence[float]) – First point(x, y)defining the first vector fromcenter.point2 (
Sequence[float]) – Second point(x, y)defining the second vector fromcenter.text (
str) – Label drawn near the arc (for example"$\\theta$").ax (
Axes|None) – Target axes. IfNone, usesmatplotlib.pyplot.gca().size (
float) – Arc diameter in the unit specified byunit.unit (
Literal['points','pixels','axes width','axes height','axes min','axes max']) – Unit used forsize. One of"points","pixels","axes width","axes height","axes min", or"axes max".textposition (
Literal['inside','outside','edge','legend']) – Label placement relative to the arc:"inside","outside","edge", or"legend". Use"legend"to hide on-plot text and usetextas the legend label of the arc.color – Shared default color for both the arc line and the text label. If omitted, both default to
rcParams["text.color"]. In either case,kwargs["color"]overrides only the arc, andtext_kw["color"]overrides only the text.text_kw (
dict|None) – Extra keyword arguments forwarded to the text annotation (e.g.fontsize,fontweight,color).**kwargs – Additional keyword arguments forwarded to
matplotlib.patches.Arc(e.g.linewidth,linestyle,alpha,zorder).
- Return type:
float- Returns:
float – The computed angle between the 2 vectors in degrees.
Examples using
sysplot.plot_angle#