
Note
Go to the end to download the full example code.
Plot Angle Example#
sysplot.plot_angle() draws a labeled arc between two vectors sharing a
common center, annotating the angle between them. The result is an arc with
a \(\theta\) label indicating the enclosed angle.
This example shows:
Basic usage with default settings
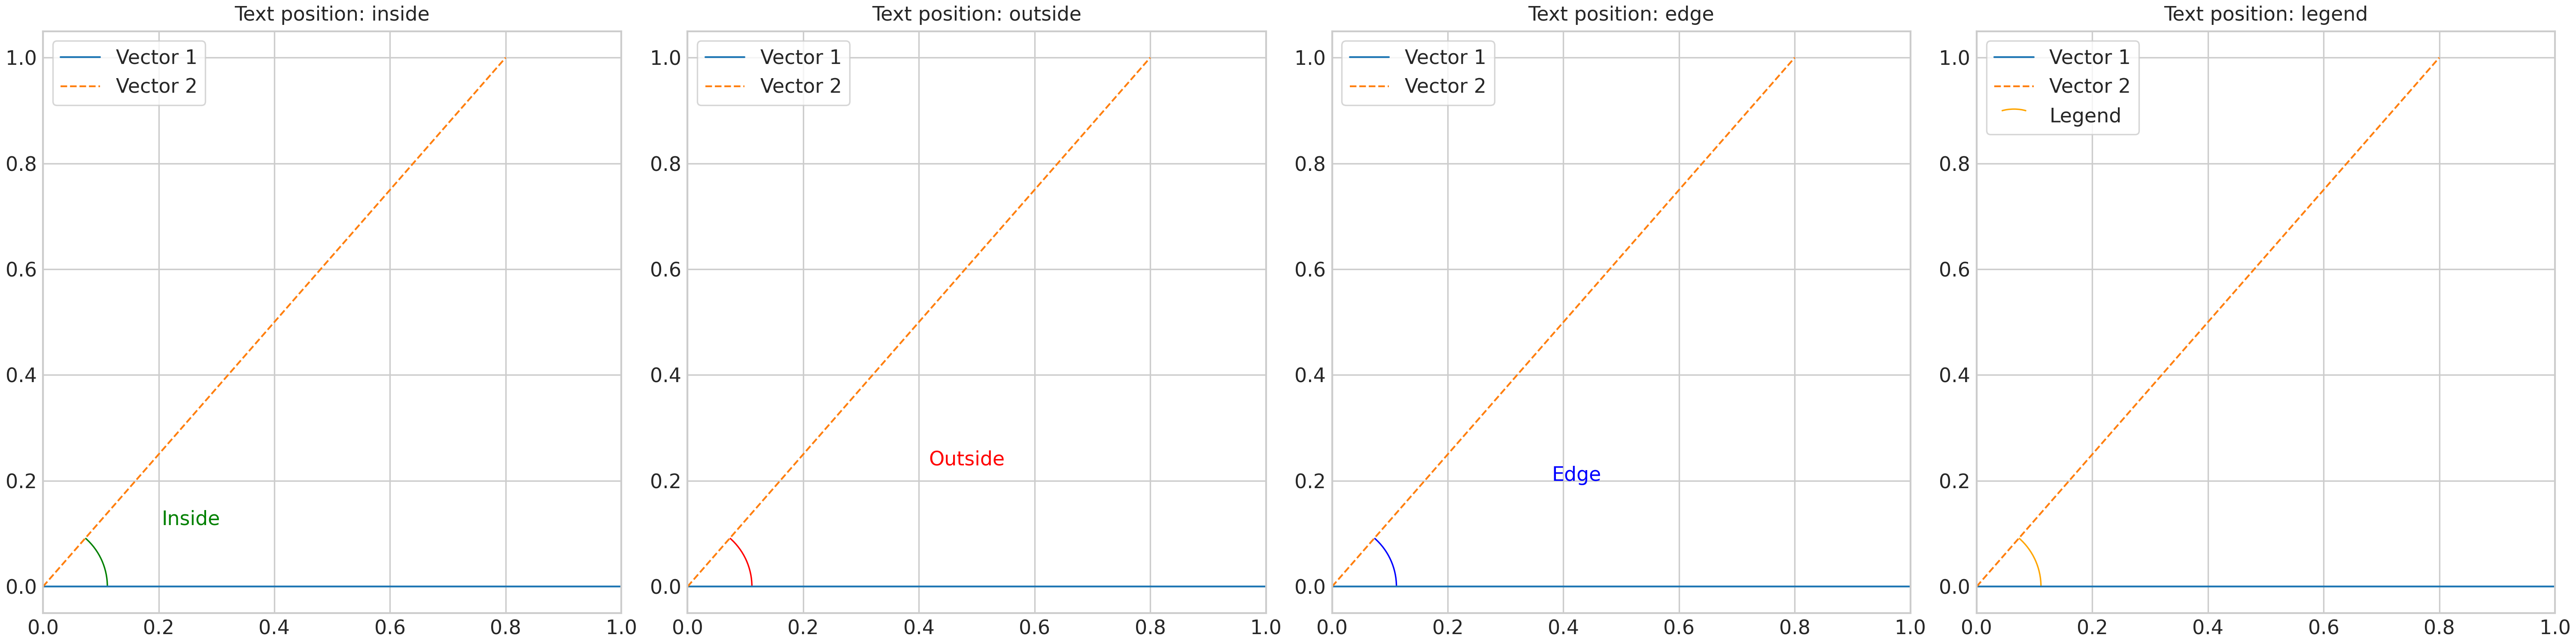
Changing text position (“inside”, “outside”, “edge”)
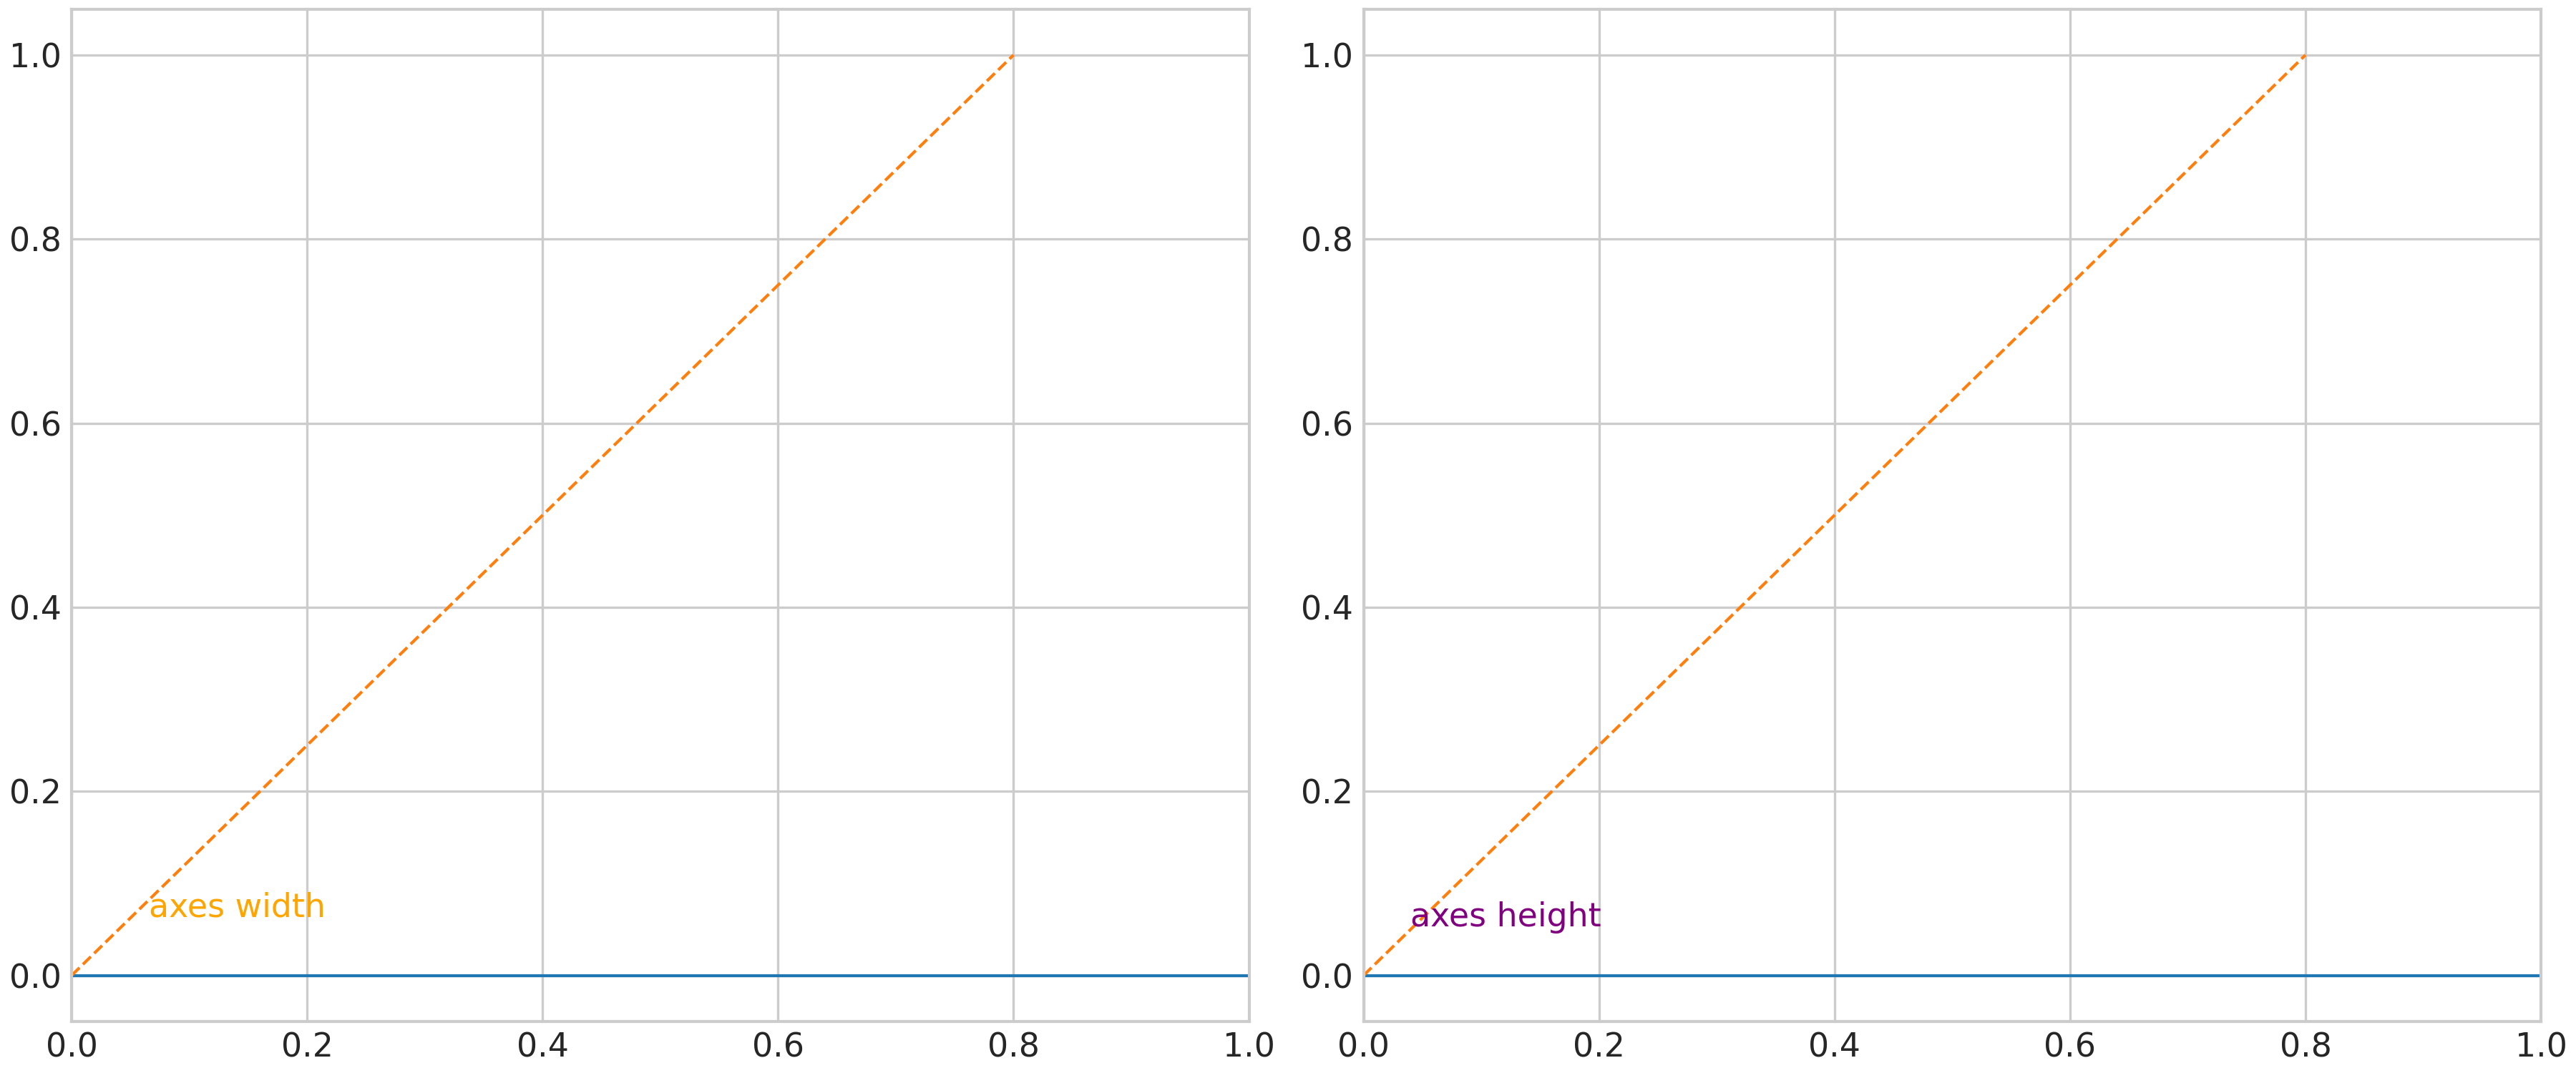
Using different units for the arc size
Accessing the computed angle
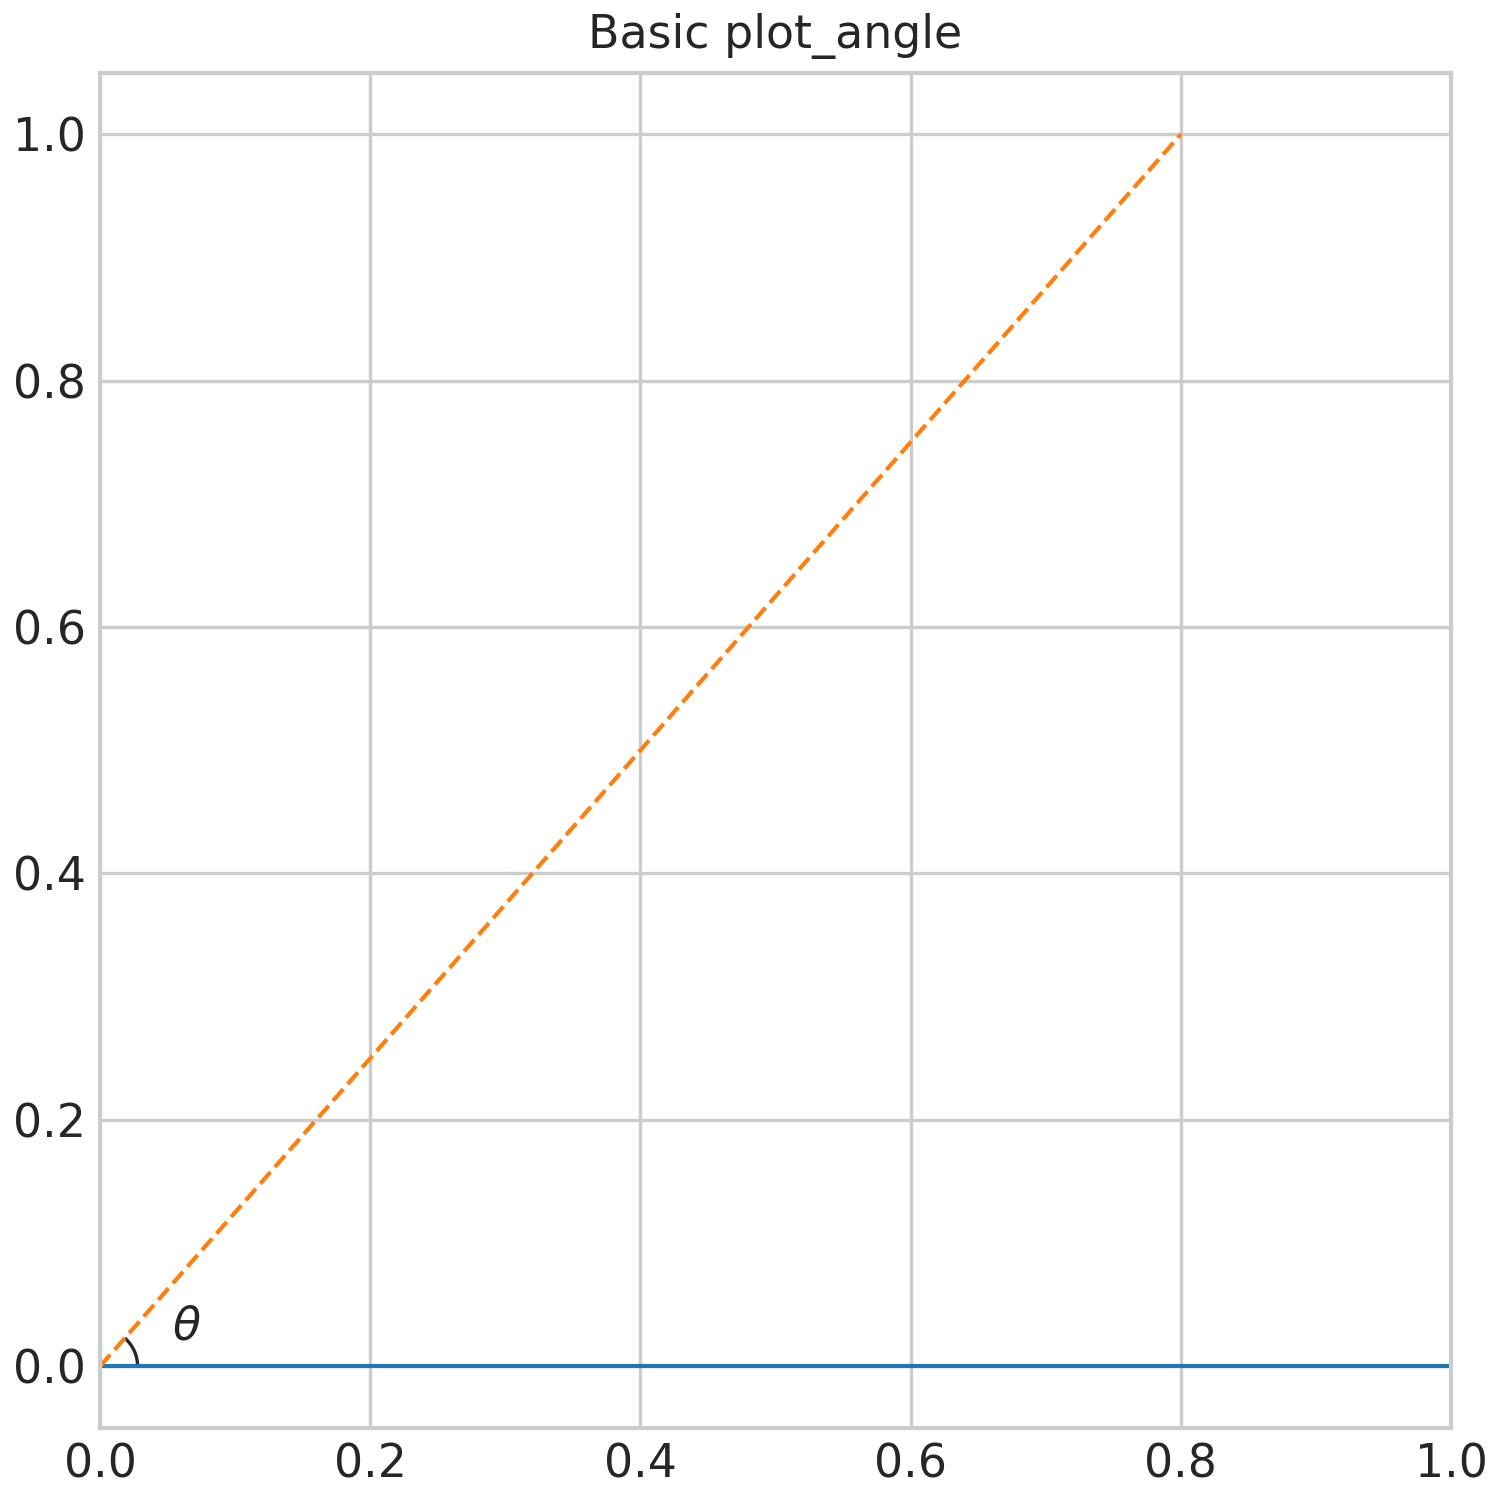
Measured angle (basic): 51.16°
import matplotlib.pyplot as plt

import sysplot as ssp

ssp.apply_config()

# --------------------------
# Define points
# --------------------------
center = (0.0, 0.0)
p1 = (1.0, 0.0)
p2 = (0.8, 1.0)

# --------------------------
# Basic usage
# --------------------------
fig, ax = plt.subplots(figsize=(5, 5))
ax.plot(*zip(center, p1), label="Vector 1")
ax.plot(*zip(center, p2), label="Vector 2")
angle_deg = ssp.plot_angle(center, p1, p2, text=r"$\theta$", ax=ax)
ax.set_title("Basic plot_angle")
print(f"Measured angle (basic): {angle_deg:.2f}°")
plt.show()

# --------------------------
# Text position variations
# --------------------------
fig, axs = plt.subplots(1, 4, figsize=(20, 5))
positions = ["inside", "outside", "edge", "legend"]
colors = ["green", "red", "blue", "orange"]

for ax, pos, color in zip(axs, positions, colors):
    ax.plot(*zip(center, p1), label="Vector 1")
    ax.plot(*zip(center, p2), label="Vector 2")
    ssp.plot_angle(
        center,
        p1,
        p2,
        text=pos.capitalize(),
        textposition=pos,
        size=300,
        ax=ax,
        color=color,
    )
    ax.set_title(f"Text position: {pos}")
    ax.legend()
plt.show()

# --------------------------
# Different size units
# --------------------------
fig, axs = plt.subplots(1, 2, figsize=(12, 5))
units = ["axes width", "axes height"]
colors = ["orange", "purple"]

for ax, unit, color in zip(axs, units, colors):
    ax.plot(*zip(center, p1), label="Vector 1")
    ax.plot(*zip(center, p2), label="Vector 2")
    ssp.plot_angle(center, p1, p2, text=unit, unit=unit, size=0.5, ax=ax, color=color)
plt.show()
Total running time of the script: (0 minutes 1.322 seconds)