
Note
Go to the end to download the full example code.
Get Figure Size#
sysplot.get_figsize() returns a (width, height) tuple scaled to a
subplot grid. It multiplies the base figure size from
sysplot.SysplotConfig by the number of columns and rows, capping each
dimension at nmax times the base size.
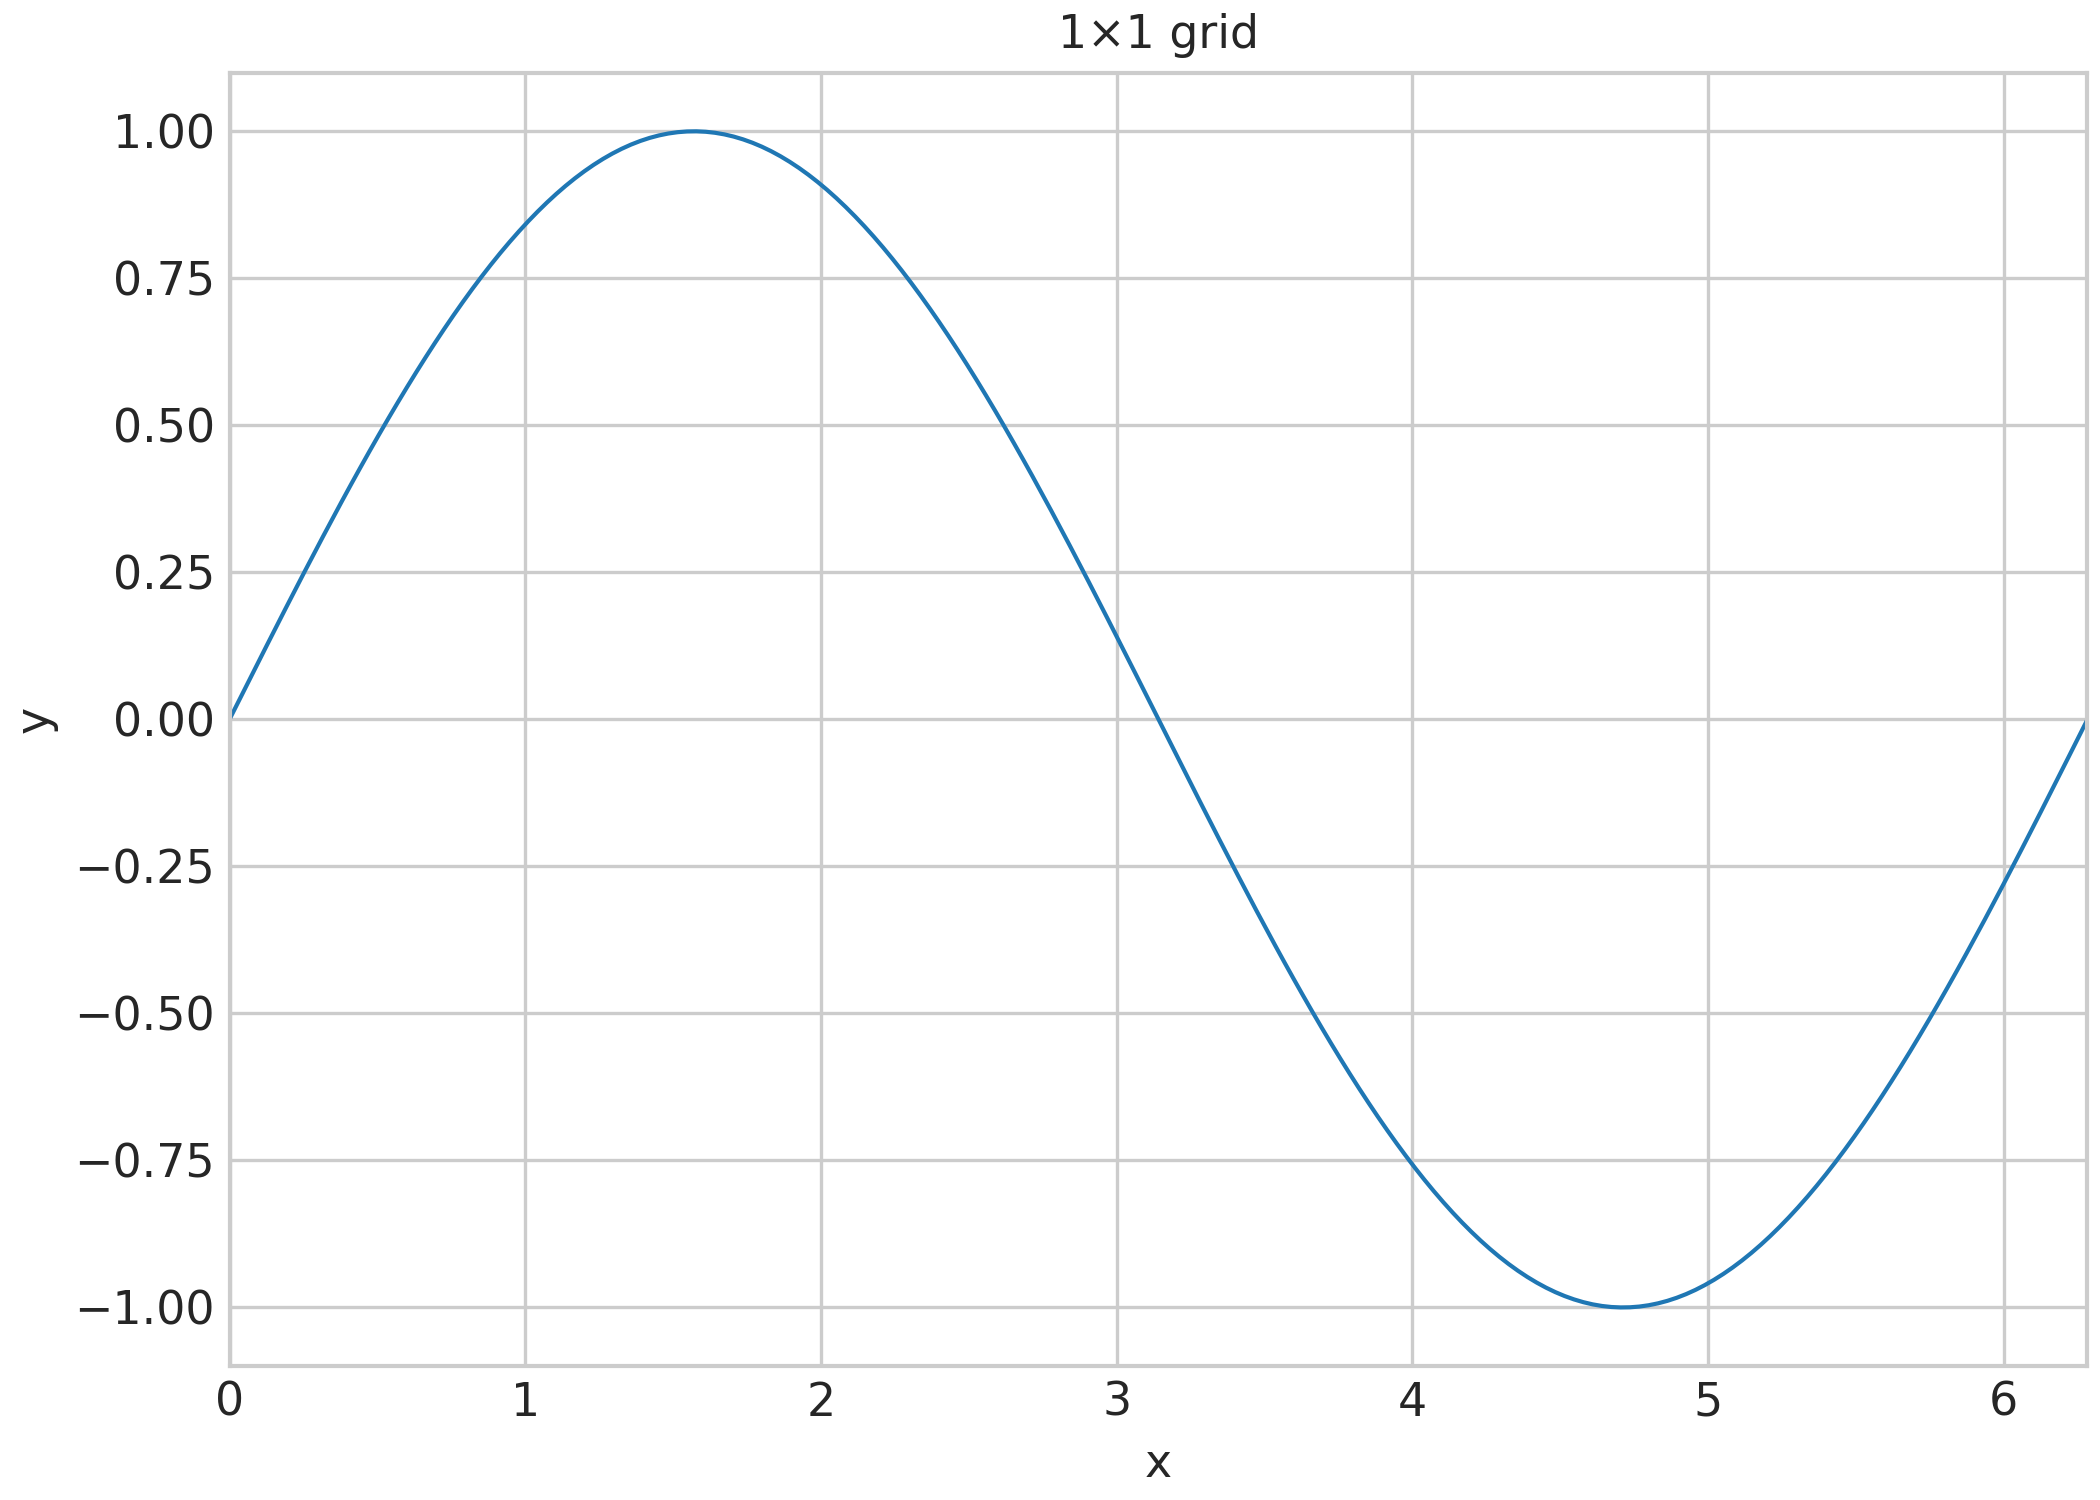
1×1: (7.0, 5.0)
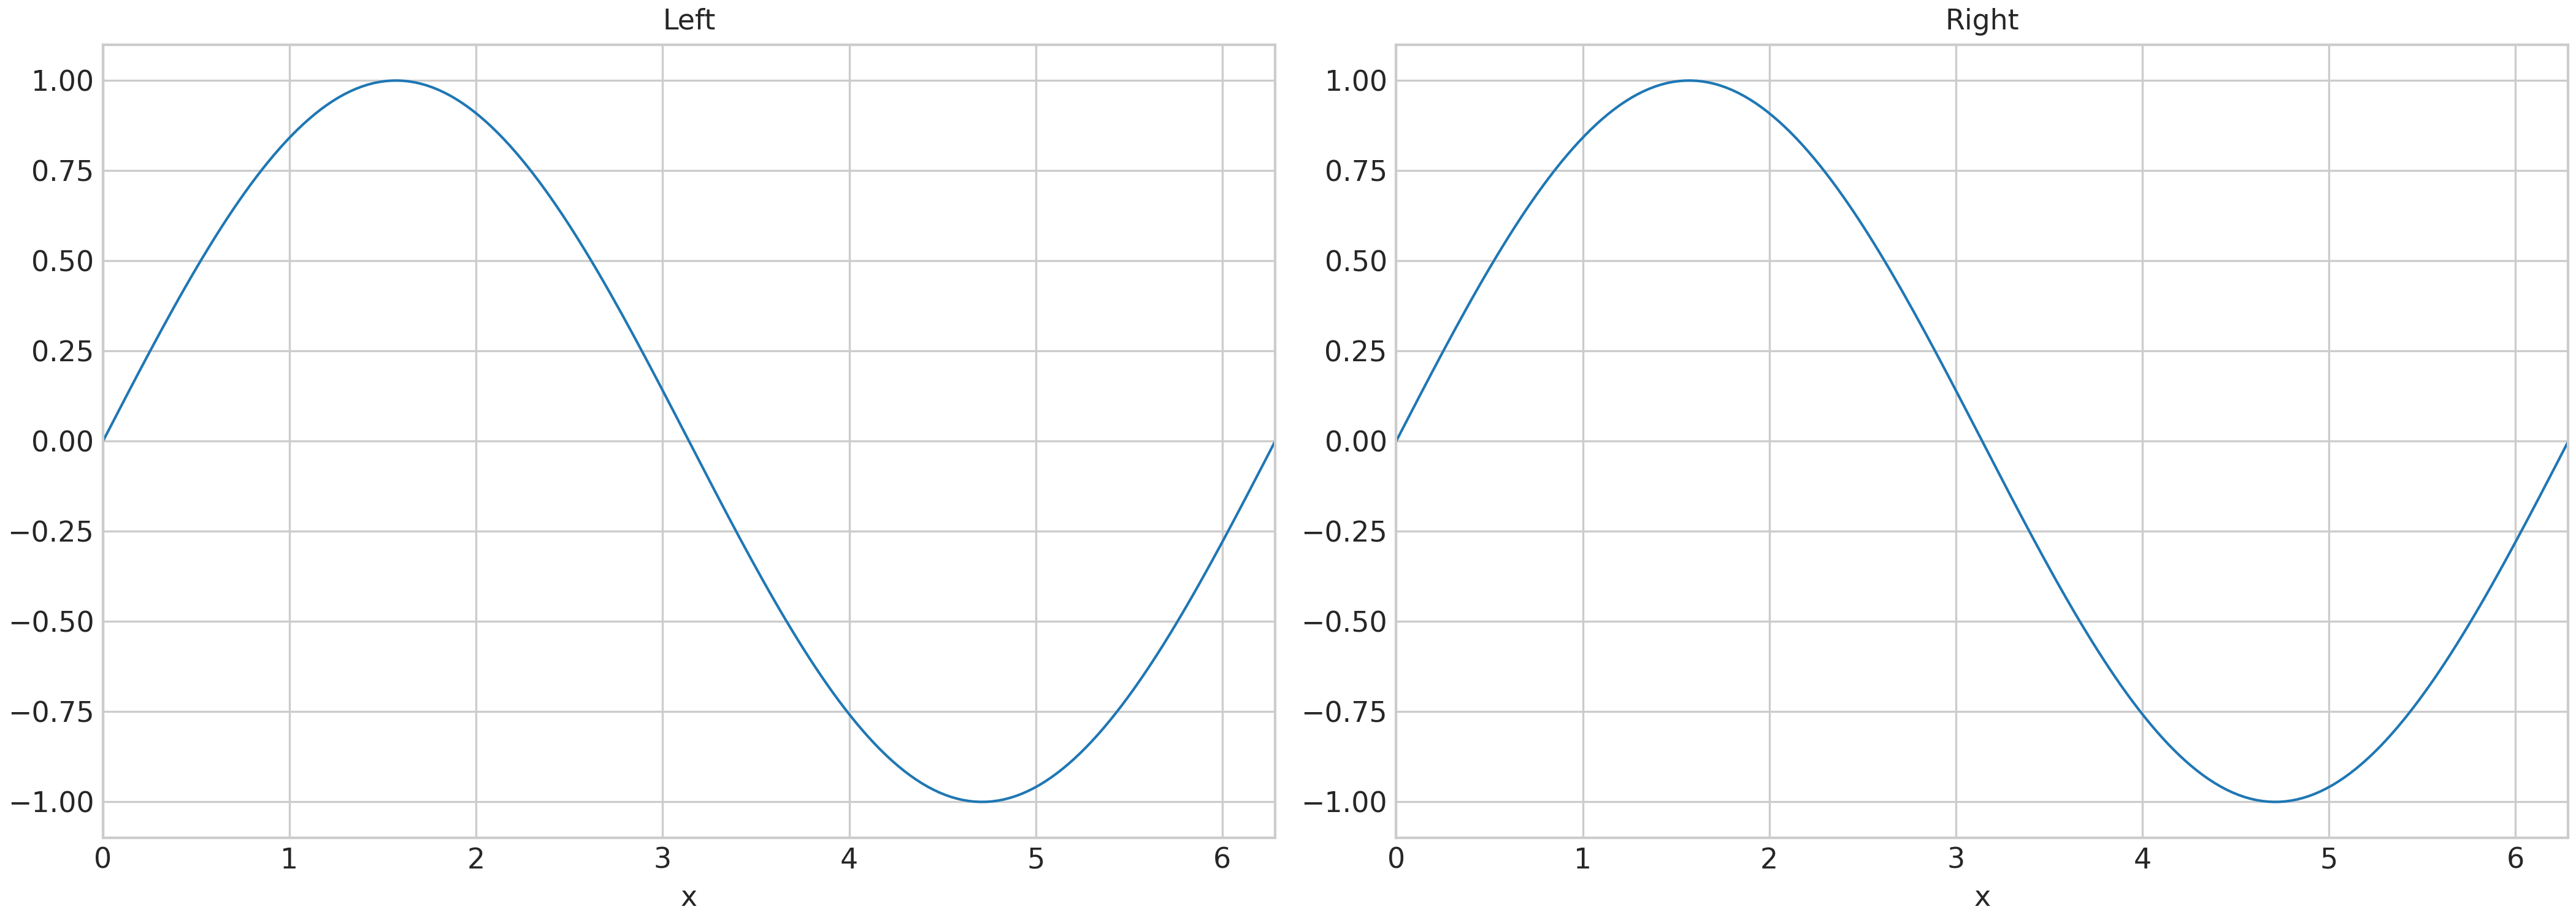
1×2: (14.0, 5.0)
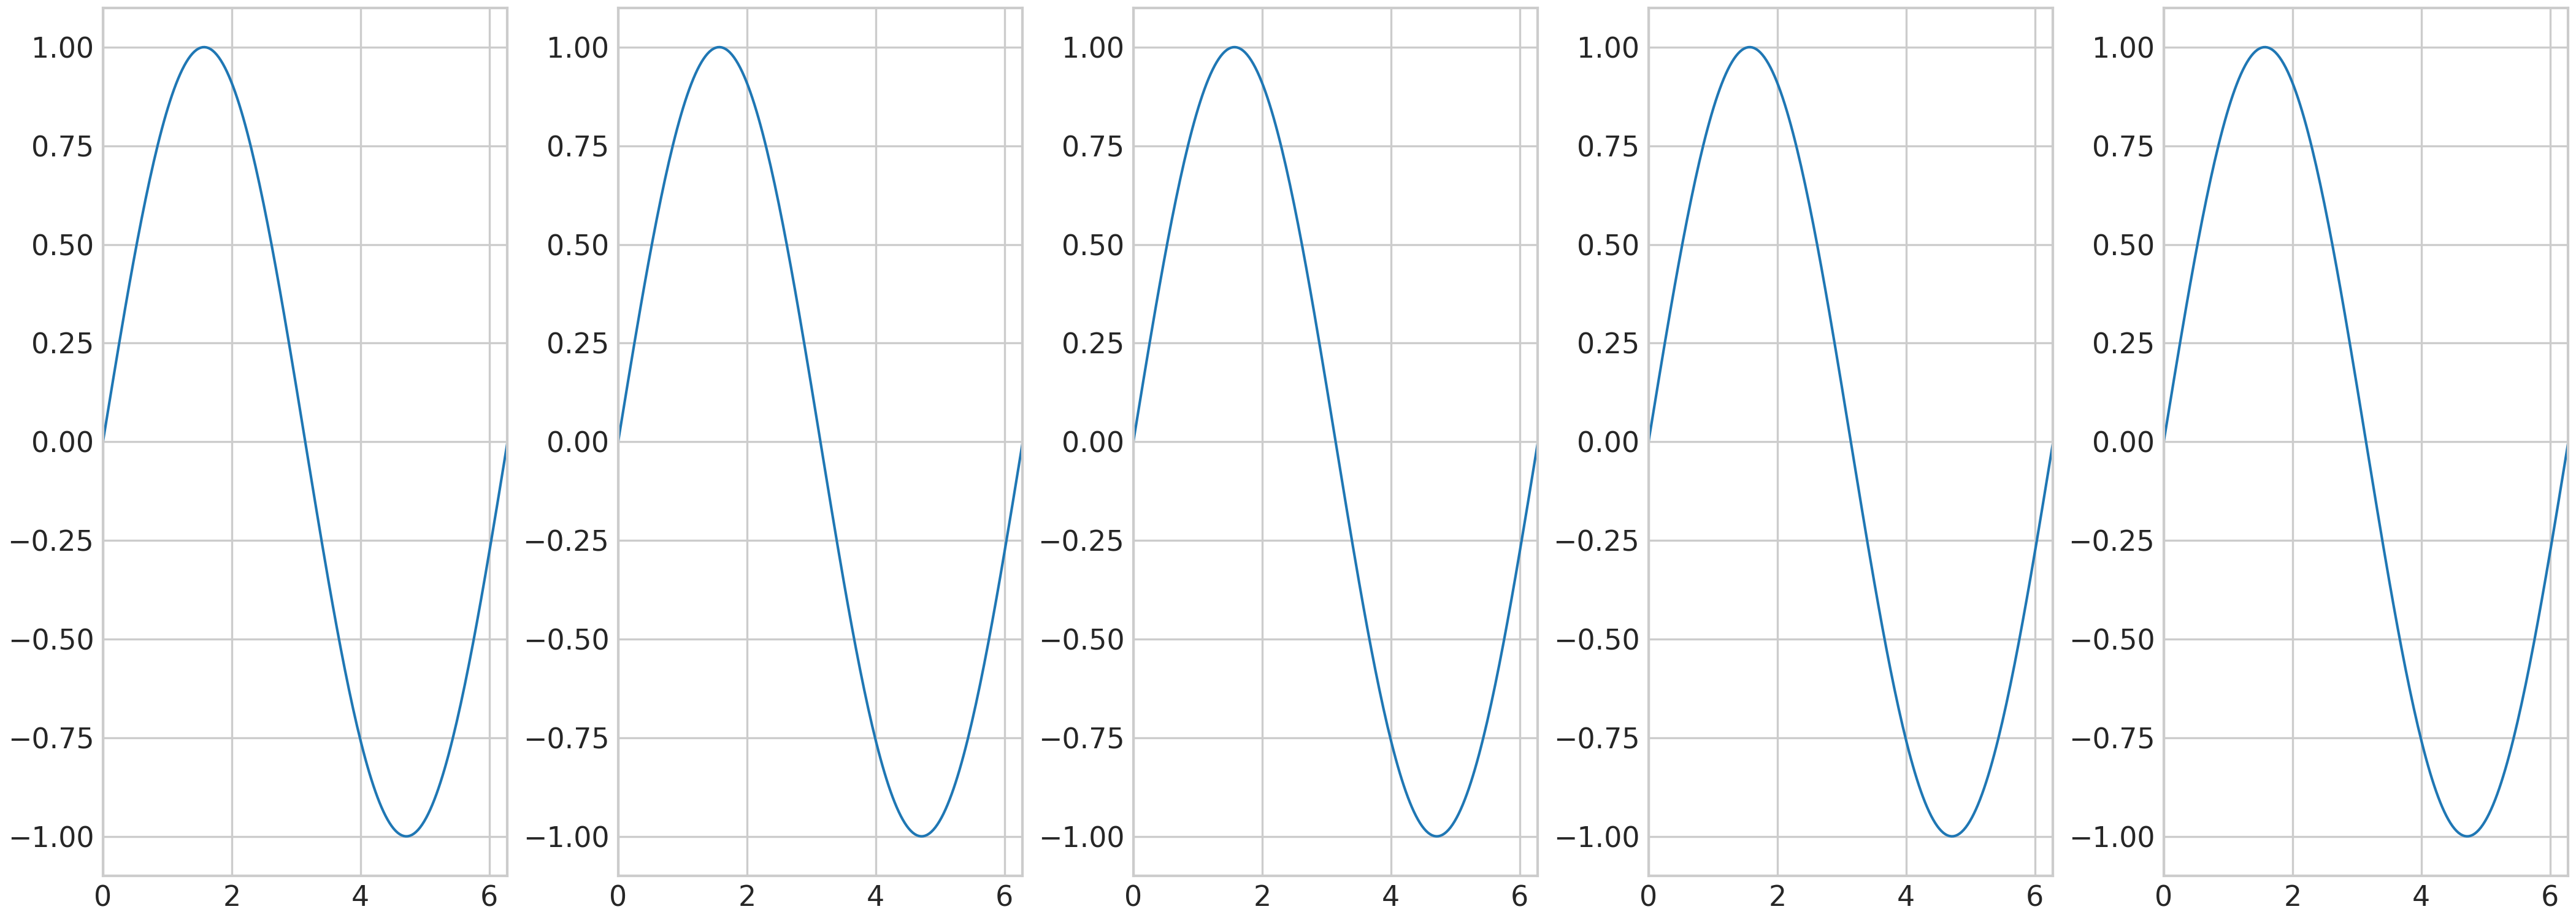
1×5 nmax=2: (14.0, 5.0)
import matplotlib.pyplot as plt
import numpy as np
import sysplot as ssp

ssp.apply_config()

x = np.linspace(0, 2 * np.pi, 200)

# 1×1 — base figure size
size = ssp.get_figsize()
print(f"1×1: {size}")
fig, ax = plt.subplots(figsize=size)
ax.plot(x, np.sin(x))
ax.set(title="1×1 grid", xlabel="x", ylabel="y")
plt.show()

# 1×2 — width is doubled
size = ssp.get_figsize(ncols=2)
print(f"1×2: {size}")
fig, axes = plt.subplots(1, 2, figsize=size)
for ax in axes:
    ax.plot(x, np.sin(x))
axes[0].set(title="Left", xlabel="x")
axes[1].set(title="Right", xlabel="x")
plt.show()

# 1×5 with nmax=2 — width capped at 2× base size
size = ssp.get_figsize(ncols=5, nmax=2)
print(f"1×5 nmax=2: {size}")
fig, axes = plt.subplots(1, 5, figsize=size)
for ax in axes:
    ax.plot(x, np.sin(x))
plt.show()
Total running time of the script: (0 minutes 1.254 seconds)