
Note
Go to the end to download the full example code.
Plot Bode#
sysplot.plot_bode() produces a two-panel Bode diagram from magnitude,
phase, and frequency arrays. Phase is automatically unwrapped and labelled
in multiples of π. The mag_to_dB flag switches between dB and linear
magnitude, and minor_ticks adds minor decade marks to the log frequency
axis.
import numpy as np
import matplotlib.pyplot as plt
import control as ctrl
import sysplot as ssp
ssp.apply_config()
system = ctrl.tf([6.25], [1, 3, 6.25])
omega = np.logspace(-2, 2, 1000)
mag, phase, _ = ctrl.frequency_response(system, omega)
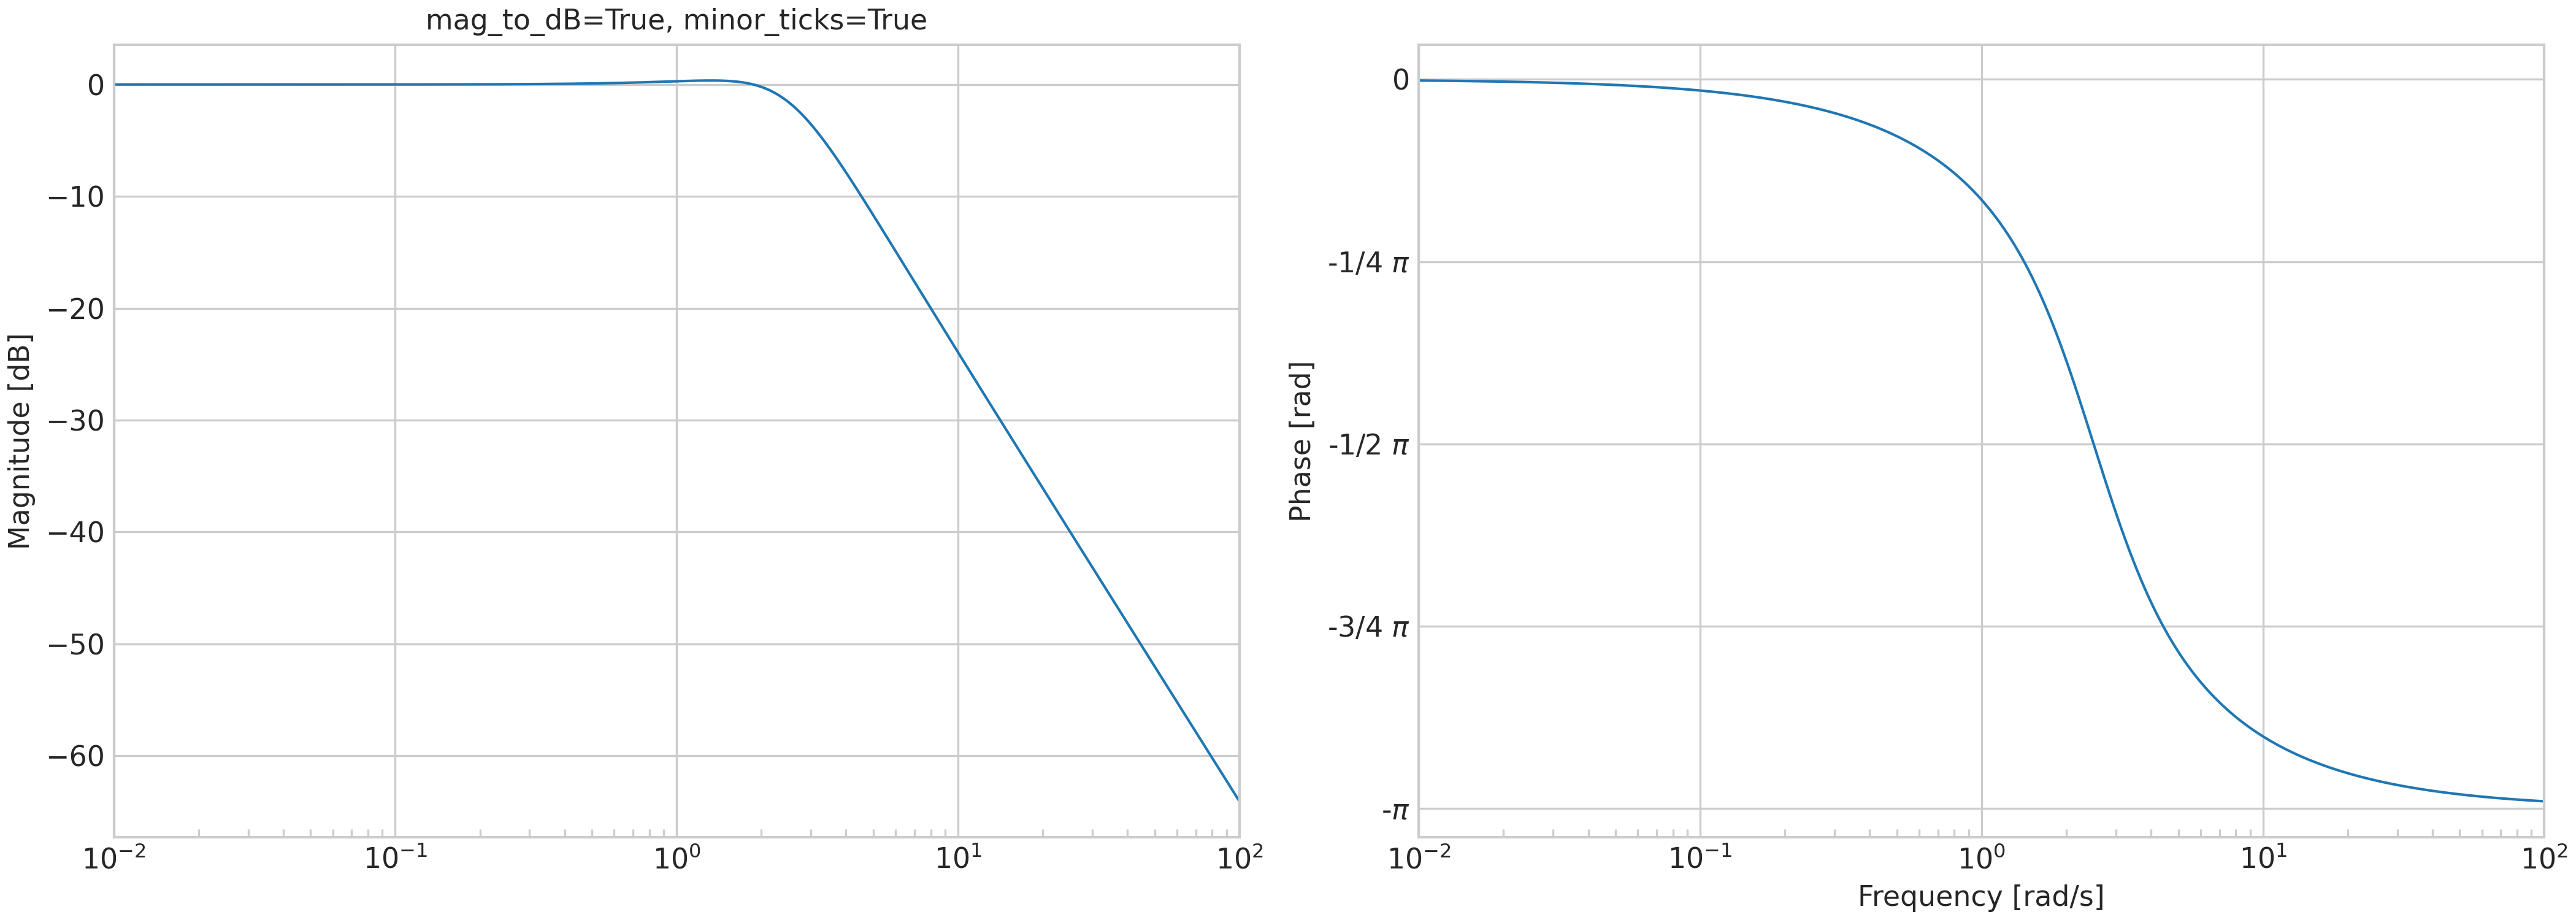
# dB magnitude with minor ticks (default behaviour)
fig, axes = plt.subplots(1, 2, figsize=ssp.get_figsize(ncols=2), sharex=True)
ssp.plot_bode(mag, phase, omega, axes=axes)
axes[0].set(title="mag_to_dB=True, minor_ticks=True", ylabel="Magnitude [dB]")
axes[1].set(ylabel="Phase [rad]", xlabel="Frequency [rad/s]")
plt.show()
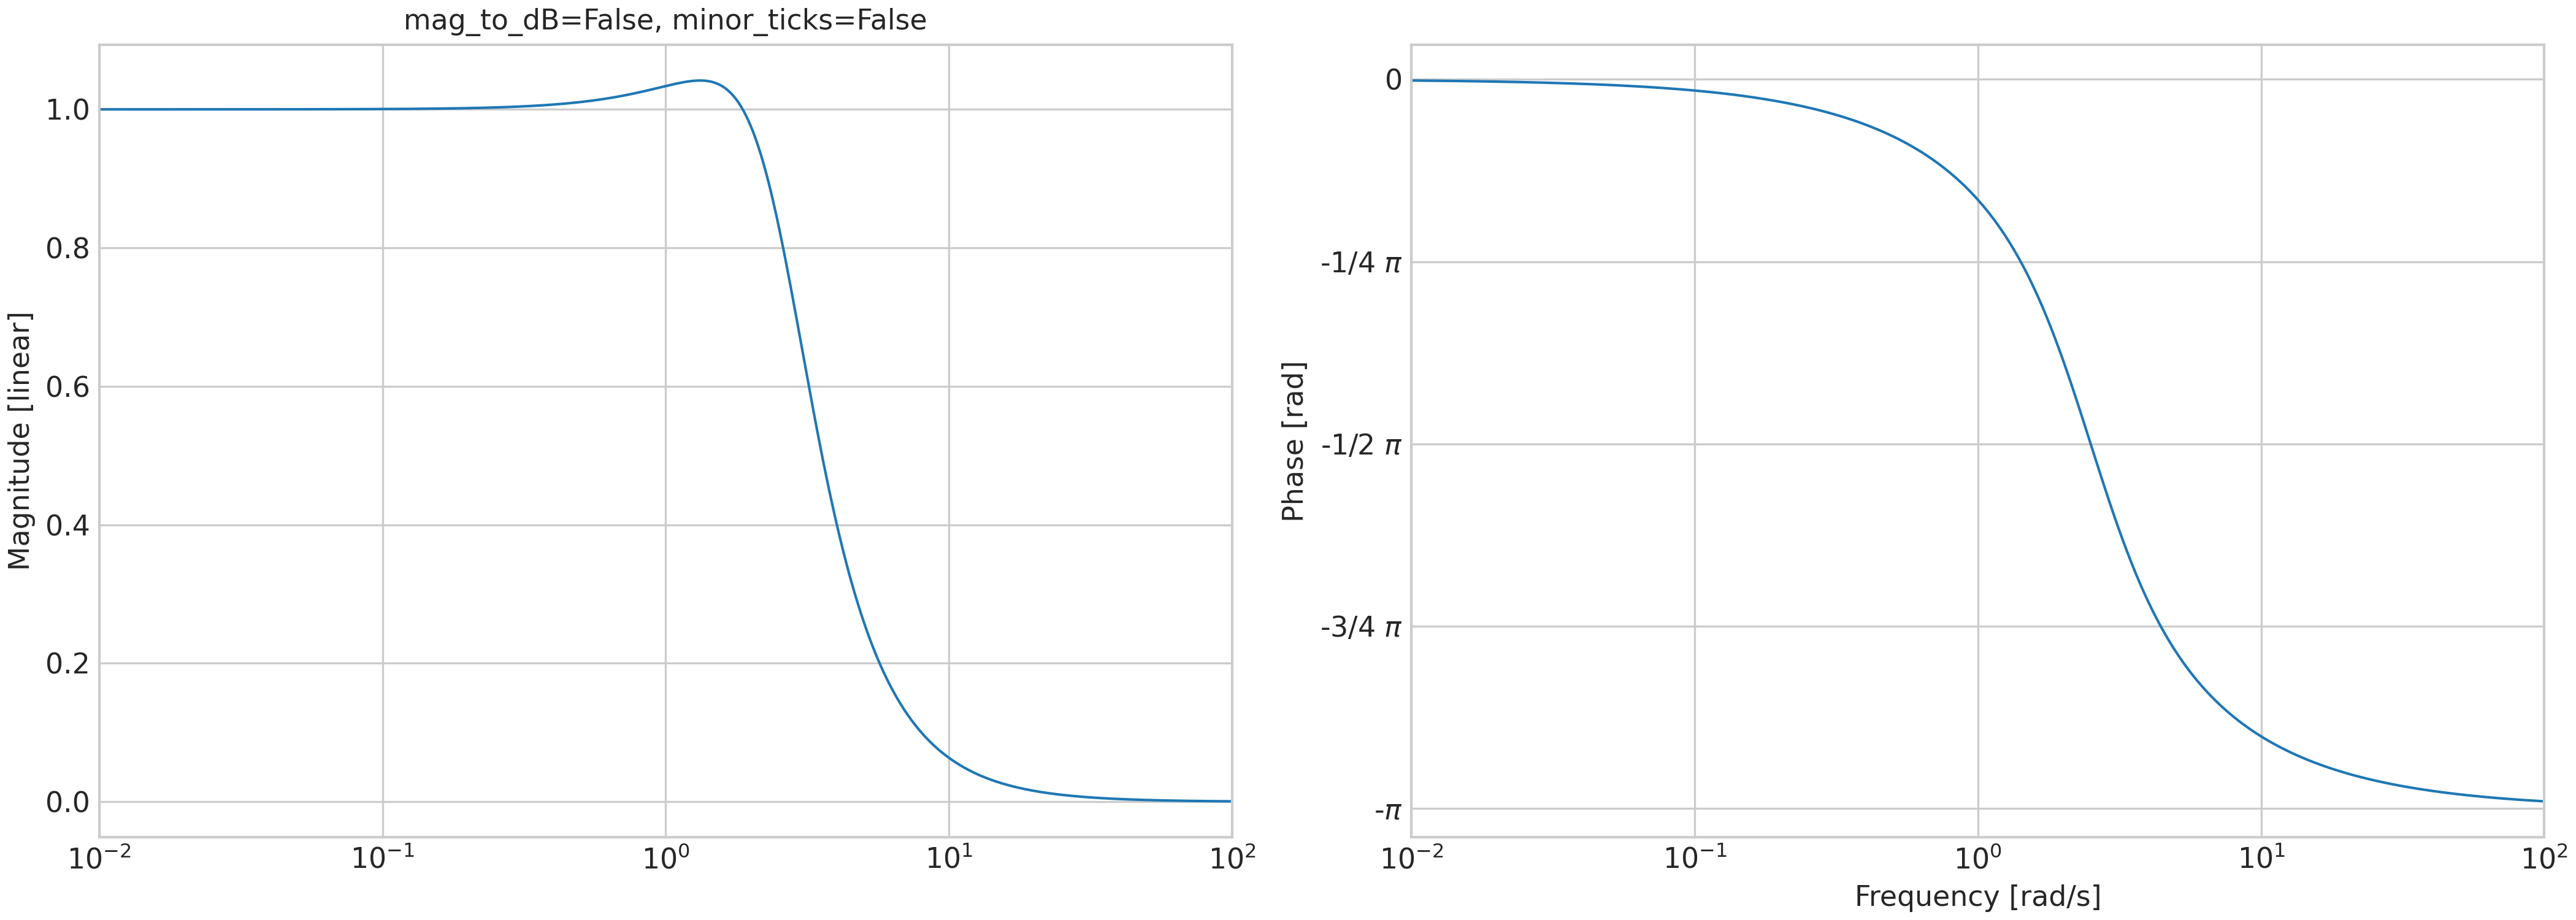
# Linear magnitude without minor ticks
fig, axes = plt.subplots(1, 2, figsize=ssp.get_figsize(ncols=2), sharex=True)
ssp.plot_bode(mag, phase, omega, axes=axes, mag_to_dB=False, minor_ticks=False)
axes[0].set(title="mag_to_dB=False, minor_ticks=False", ylabel="Magnitude [linear]")
axes[1].set(ylabel="Phase [rad]", xlabel="Frequency [rad/s]")
plt.show()
Total running time of the script: (0 minutes 1.194 seconds)