
Note
Go to the end to download the full example code.
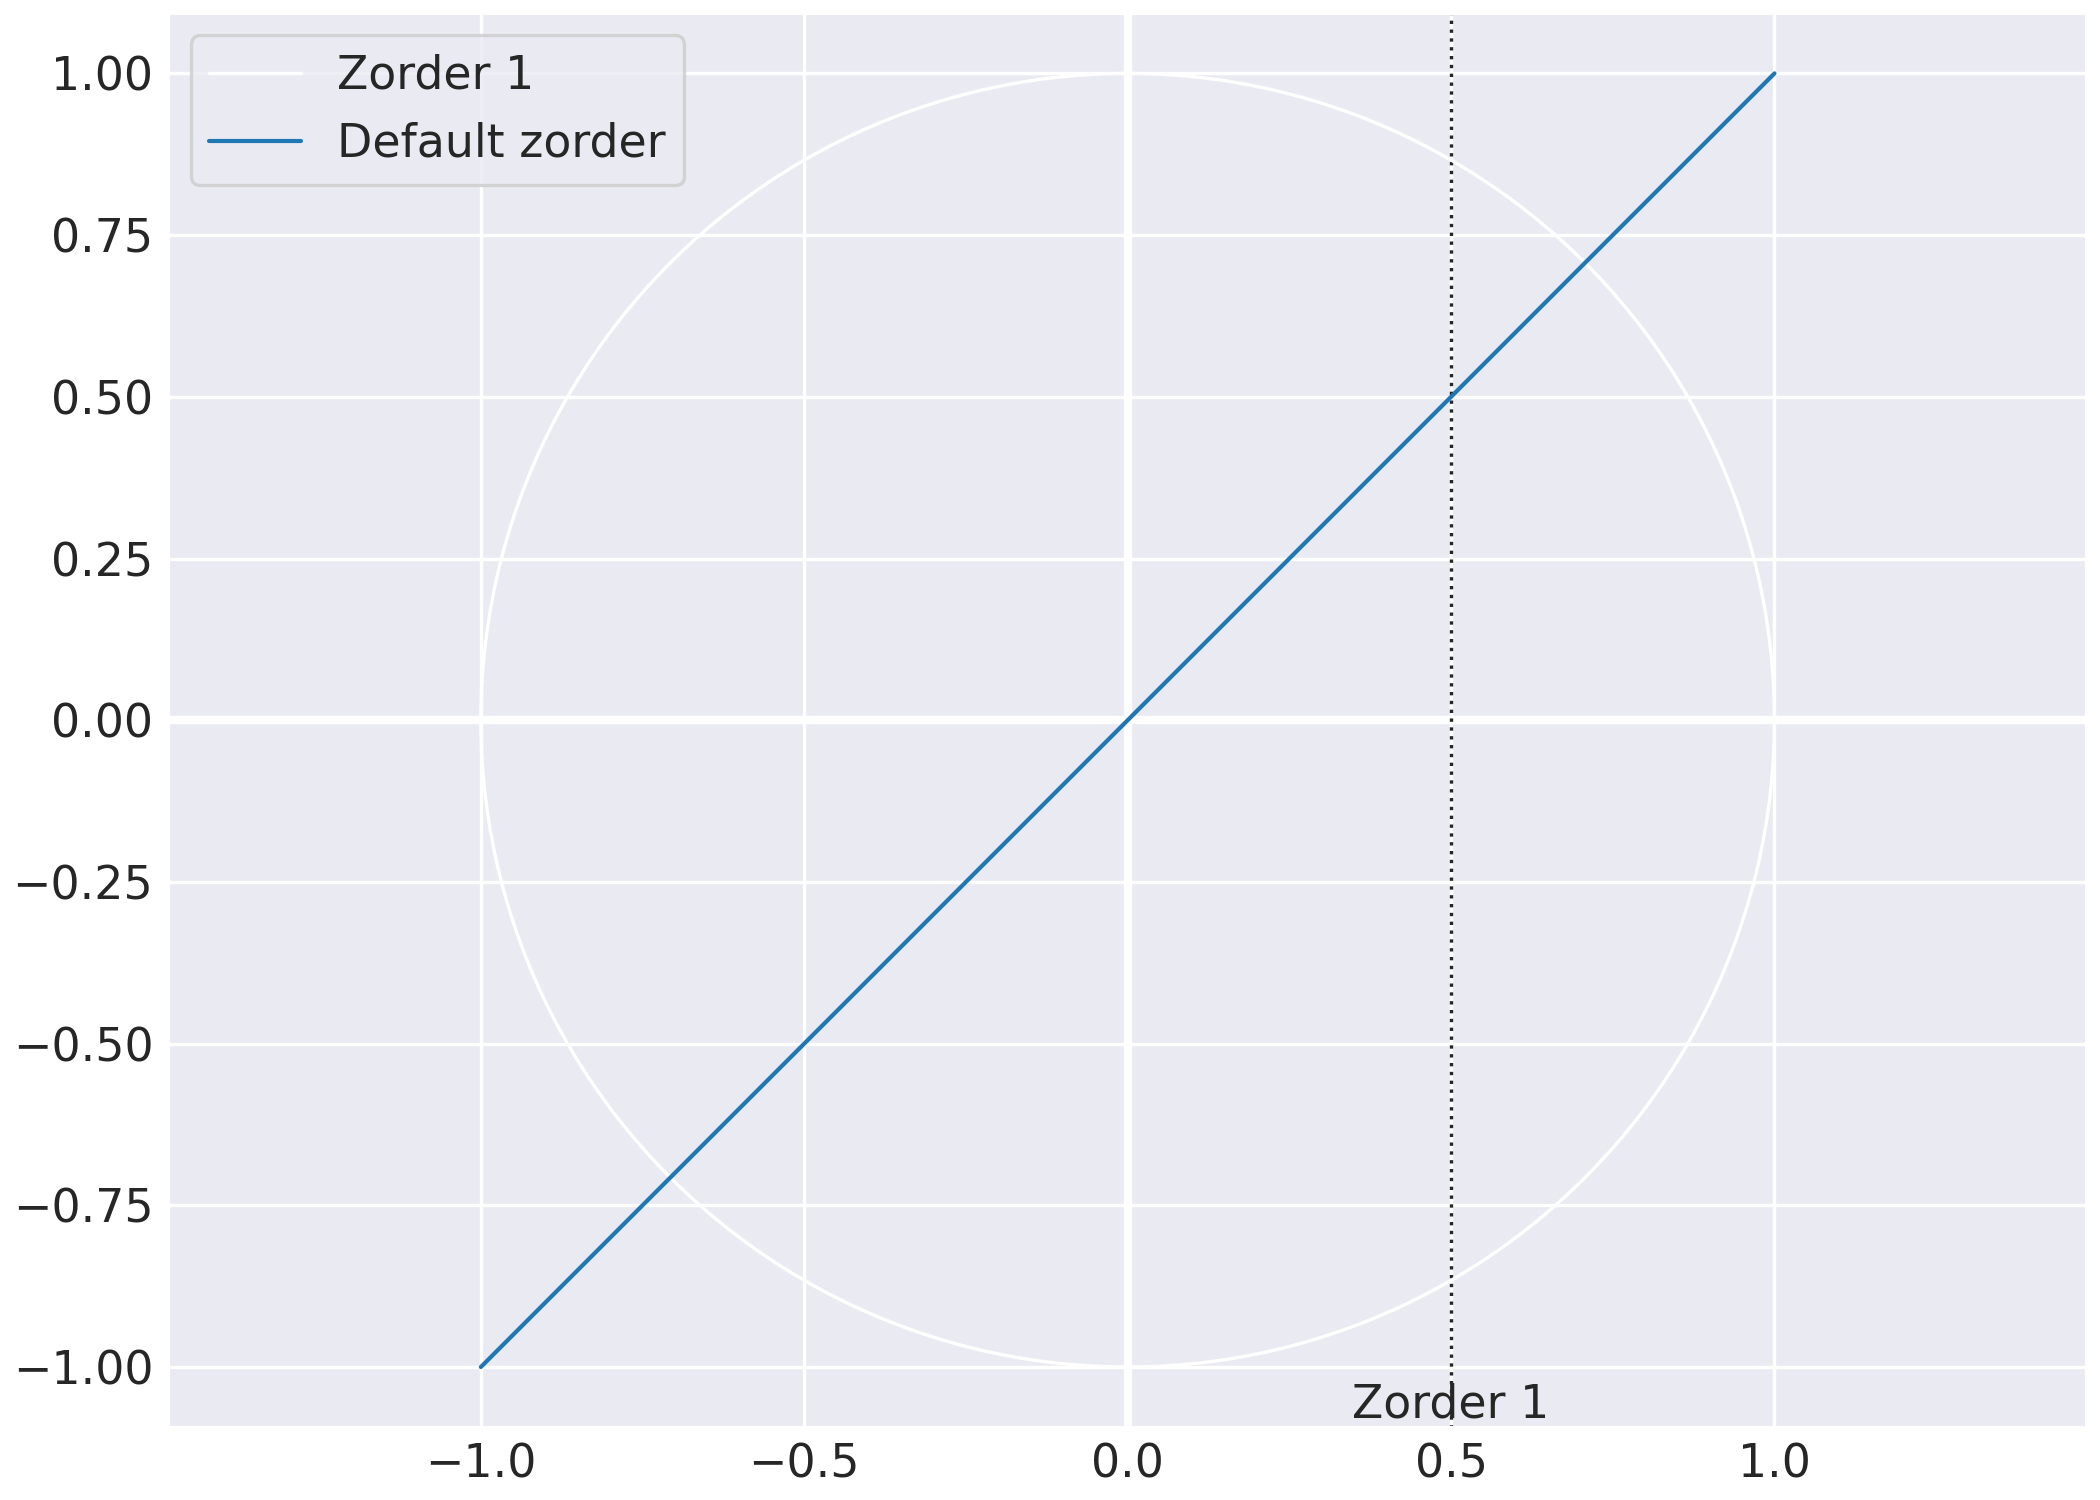
Zorder Example#
Zorder controls the drawing order of plot elements.
Elements with higher zorder values are drawn on top of those with lower values. This example demonstrates how to use zorder to control a plot call resulting betwenn gridlines and other plot calls.
import matplotlib.pyplot as plt
import sysplot as ssp

ssp.apply_config(seaborn_style="darkgrid")

fig, ax = plt.subplots()

# should be above gridlines, but below plt.plot()
ssp.emphasize_coord_lines(fig)  # uses zorder =1

# should be the same as emphasize_coord_lines.
ssp.plot_unit_circle(ax=ax, zorder=1.5, label="Zorder 1")

# should be above both gridlines and emphasize_coord_lines but below plt.plot()
ssp.add_tick_line(value=0.5, label="Zorder 1", axis=ax.xaxis, zorder=1)

# default zorder.
plt.plot([-1, 1], [-1, 1], label="Default zorder")

plt.legend()
plt.show()
Total running time of the script: (0 minutes 0.224 seconds)