
Note
Go to the end to download the full example code.
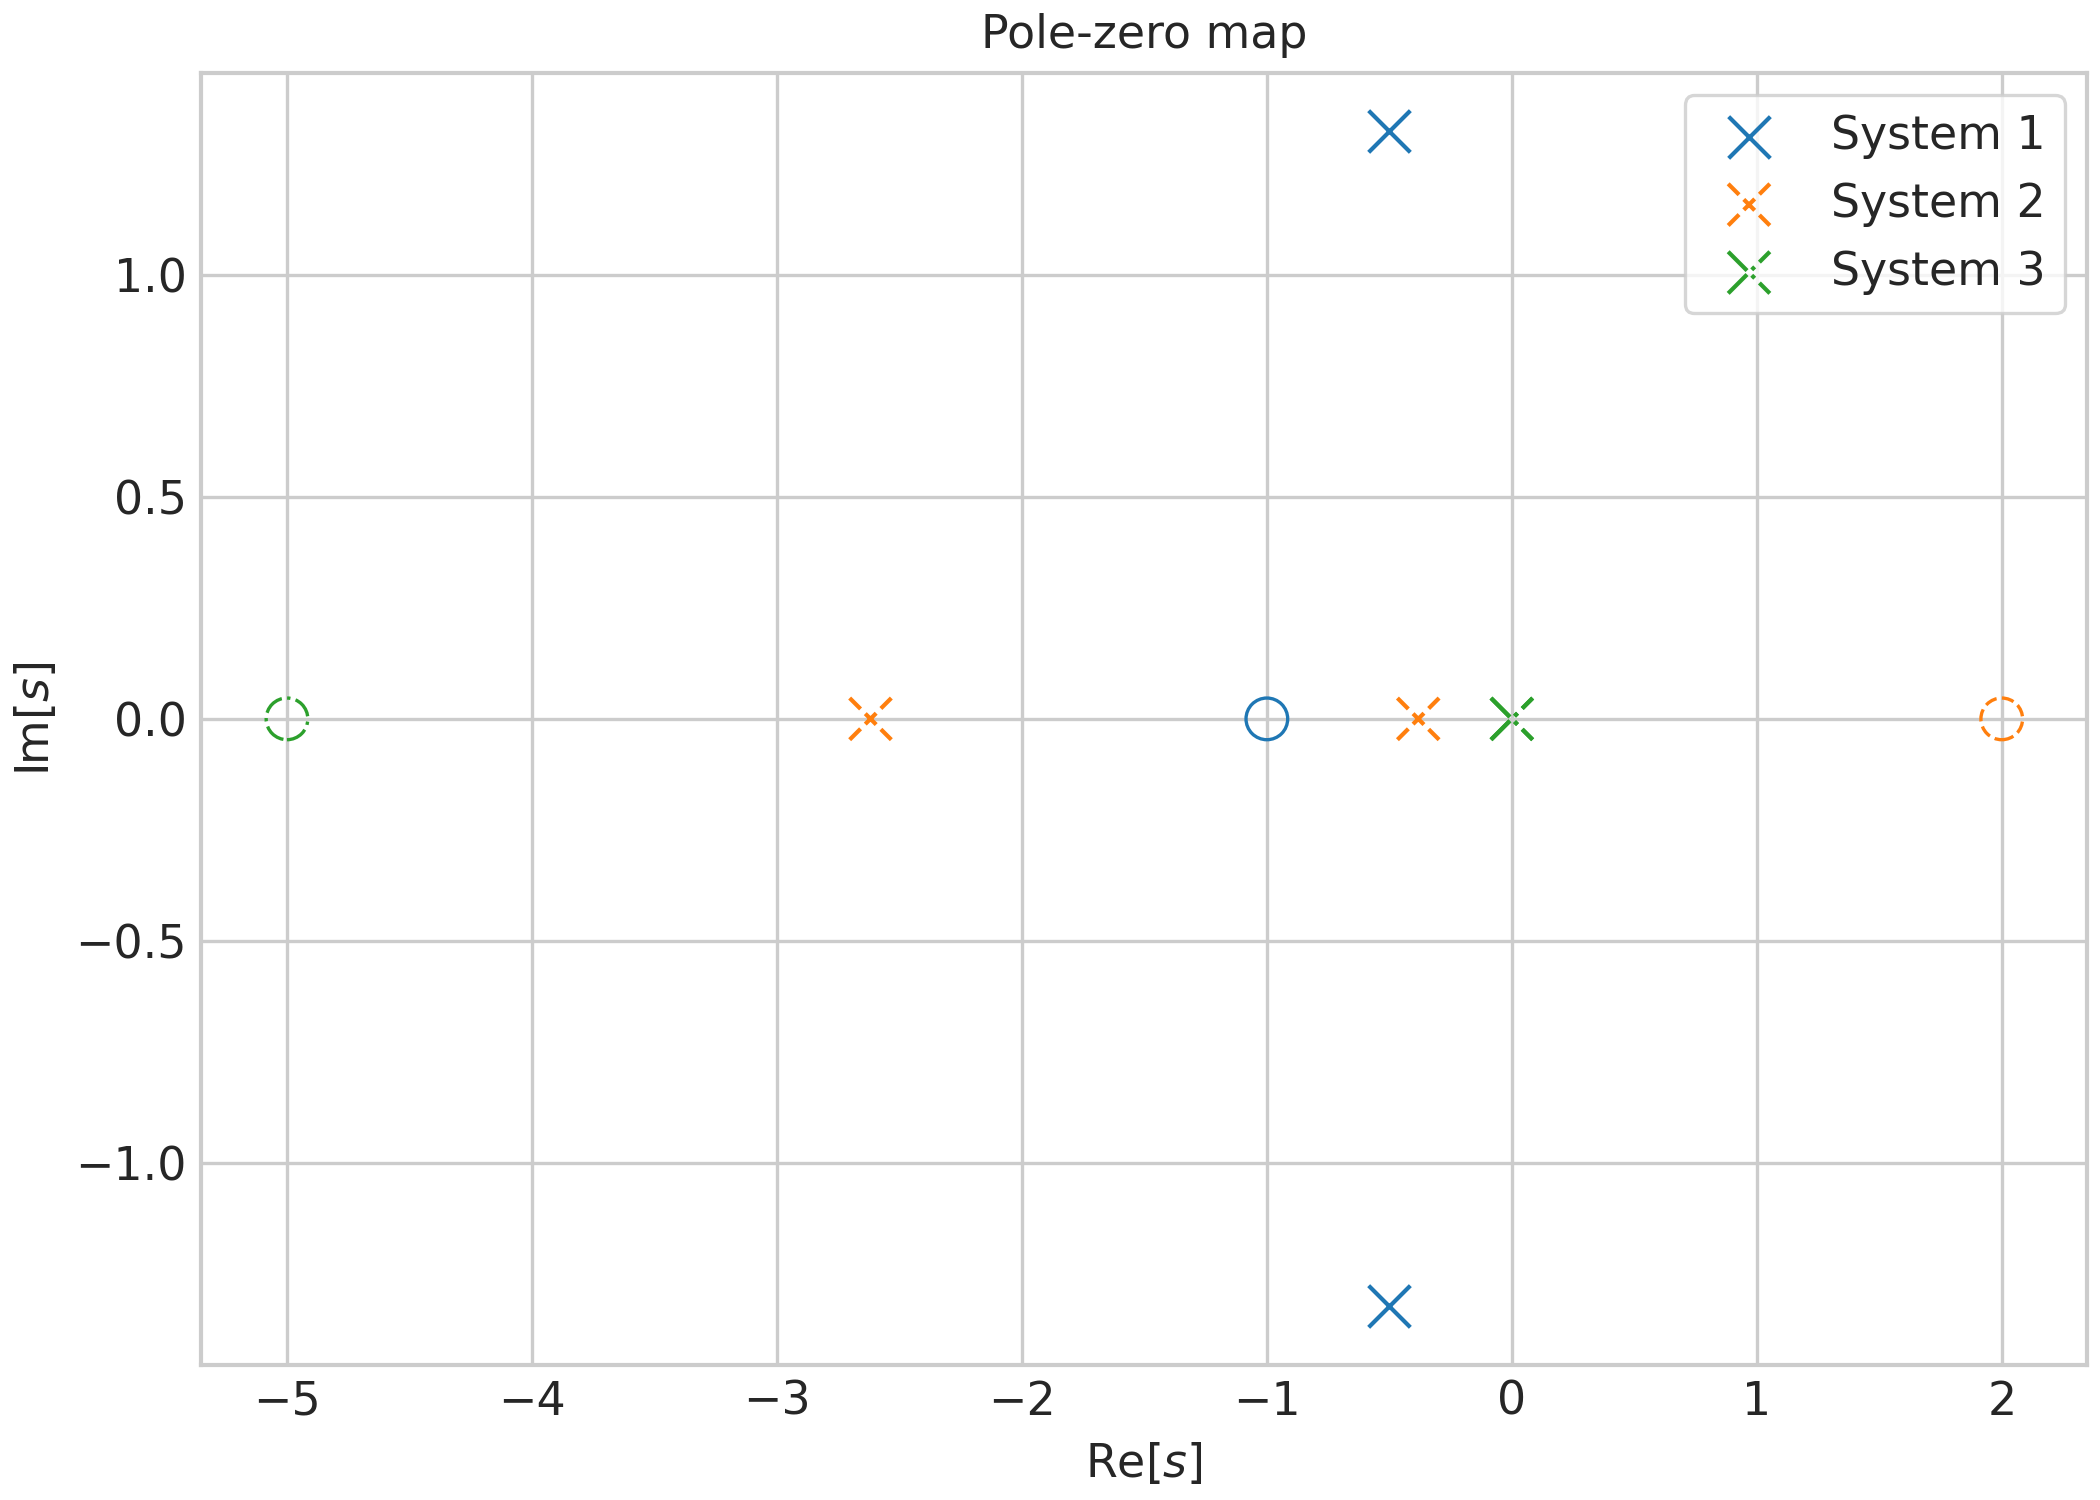
Plot Poles and Zeros#
sysplot.plot_poles_zeros() draws poles as x markers and zeros as
hollow circles o on the complex plane. Multiple calls to the function
automatically cycle through colors and linestyles, making it easy to overlay
several systems on the same axes.
import matplotlib.pyplot as plt
import control as ctrl
import sysplot as ssp

ssp.apply_config()

# First system: underdamped second-order
system1 = ctrl.tf([1, 1], [1, 1, 2])
poles1 = ctrl.poles(system1)
zeros1 = ctrl.zeros(system1)

# Second system: third-order with distinct poles
system2 = ctrl.tf([1, -2], [1, 3, 1])
poles2 = ctrl.poles(system2)
zerors2 = ctrl.zeros(system2)

# third system: second-order with repeated poles at the origin
system3 = ctrl.tf([1, 5], [1, 0, 0])
poles3 = ctrl.poles(system3)
zerors3 = ctrl.zeros(system3)

fig, ax = plt.subplots(figsize=ssp.get_figsize())

ssp.plot_poles_zeros(poles=poles1, zeros=zeros1, label="System 1", ax=ax)
ssp.plot_poles_zeros(poles=poles2, zeros=zerors2, label="System 2", ax=ax)
ssp.plot_poles_zeros(poles=poles3, zeros=zerors3, label="System 3", ax=ax)

ax.set(title="Pole-zero map", xlabel=r"Re[$s$]", ylabel=r"Im[$s$]")
ax.legend()
plt.show()
Total running time of the script: (0 minutes 0.232 seconds)