
Note
Go to the end to download the full example code.
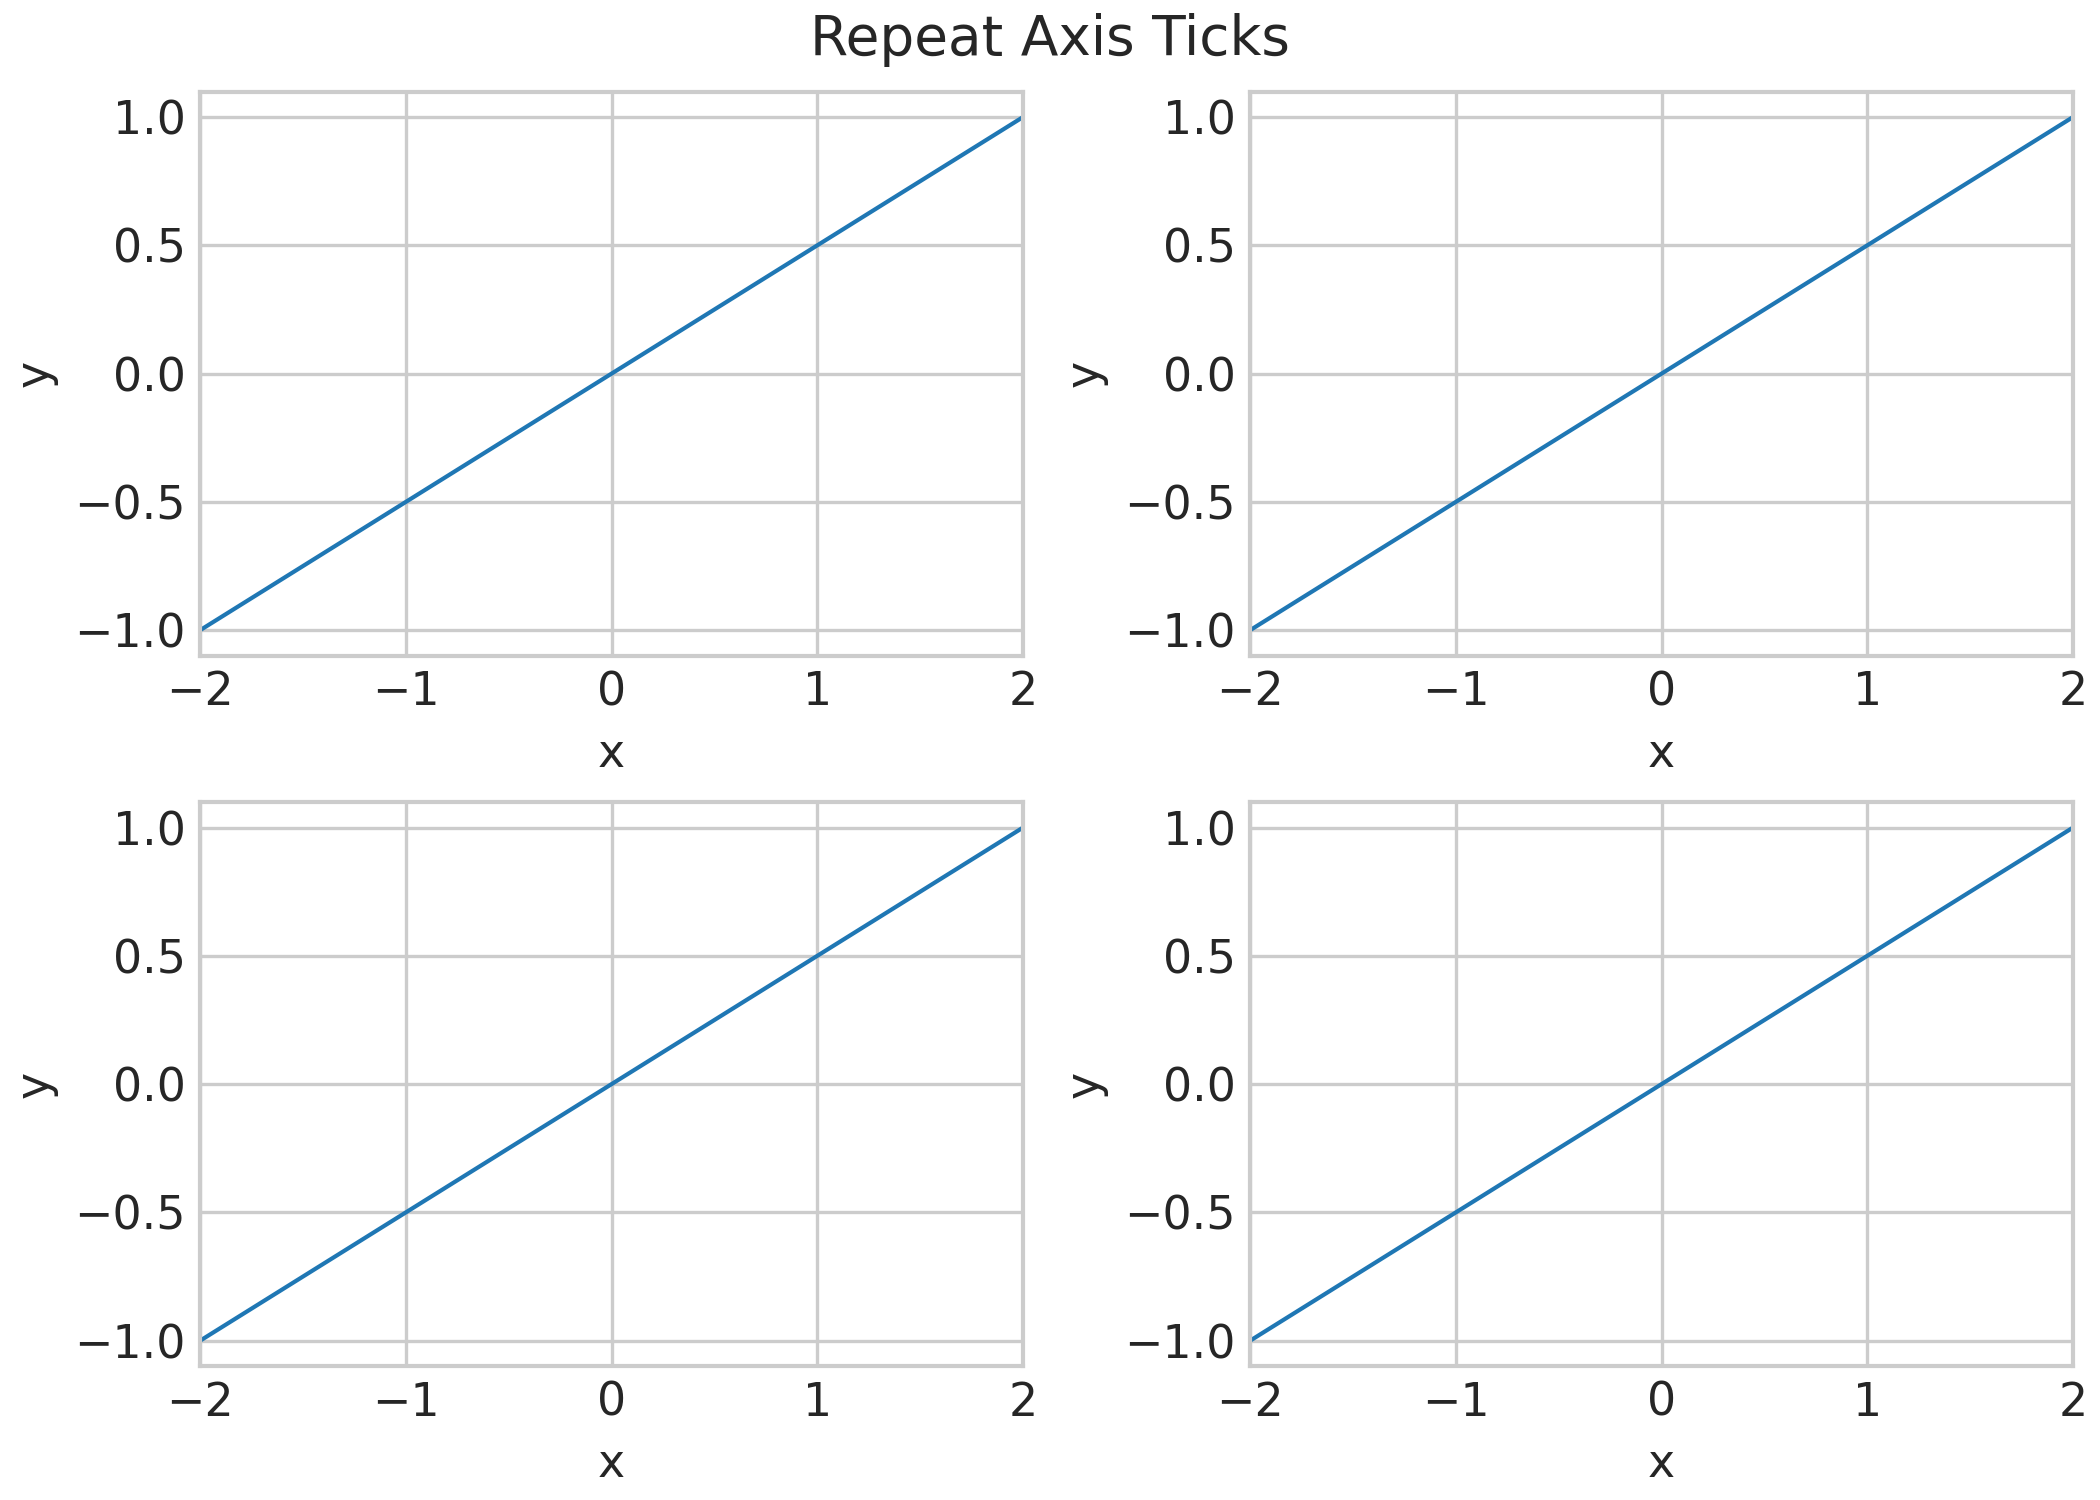
Repeat Axis Ticks Example#
When sharex or sharey is used, Matplotlib suppresses tick labels on
inner subplots. sysplot.restore_tick_labels() restores them so every
subplot in the grid displays its own axis labels.
import matplotlib.pyplot as plt
import sysplot as ssp

ssp.apply_config()

fig, ax = plt.subplots(2, 2, sharex=True, sharey=True)

# shows the axis ticks labels on every subplot, even when axes are shared.
ssp.restore_tick_labels(fig)

for a in ax.flatten():
    a.plot([-2, 2], [-1, 1])
    a.set(xlabel="x", ylabel="y")

plt.suptitle("Repeat Axis Ticks")

plt.show()
Total running time of the script: (0 minutes 0.350 seconds)