
Note
Go to the end to download the full example code.
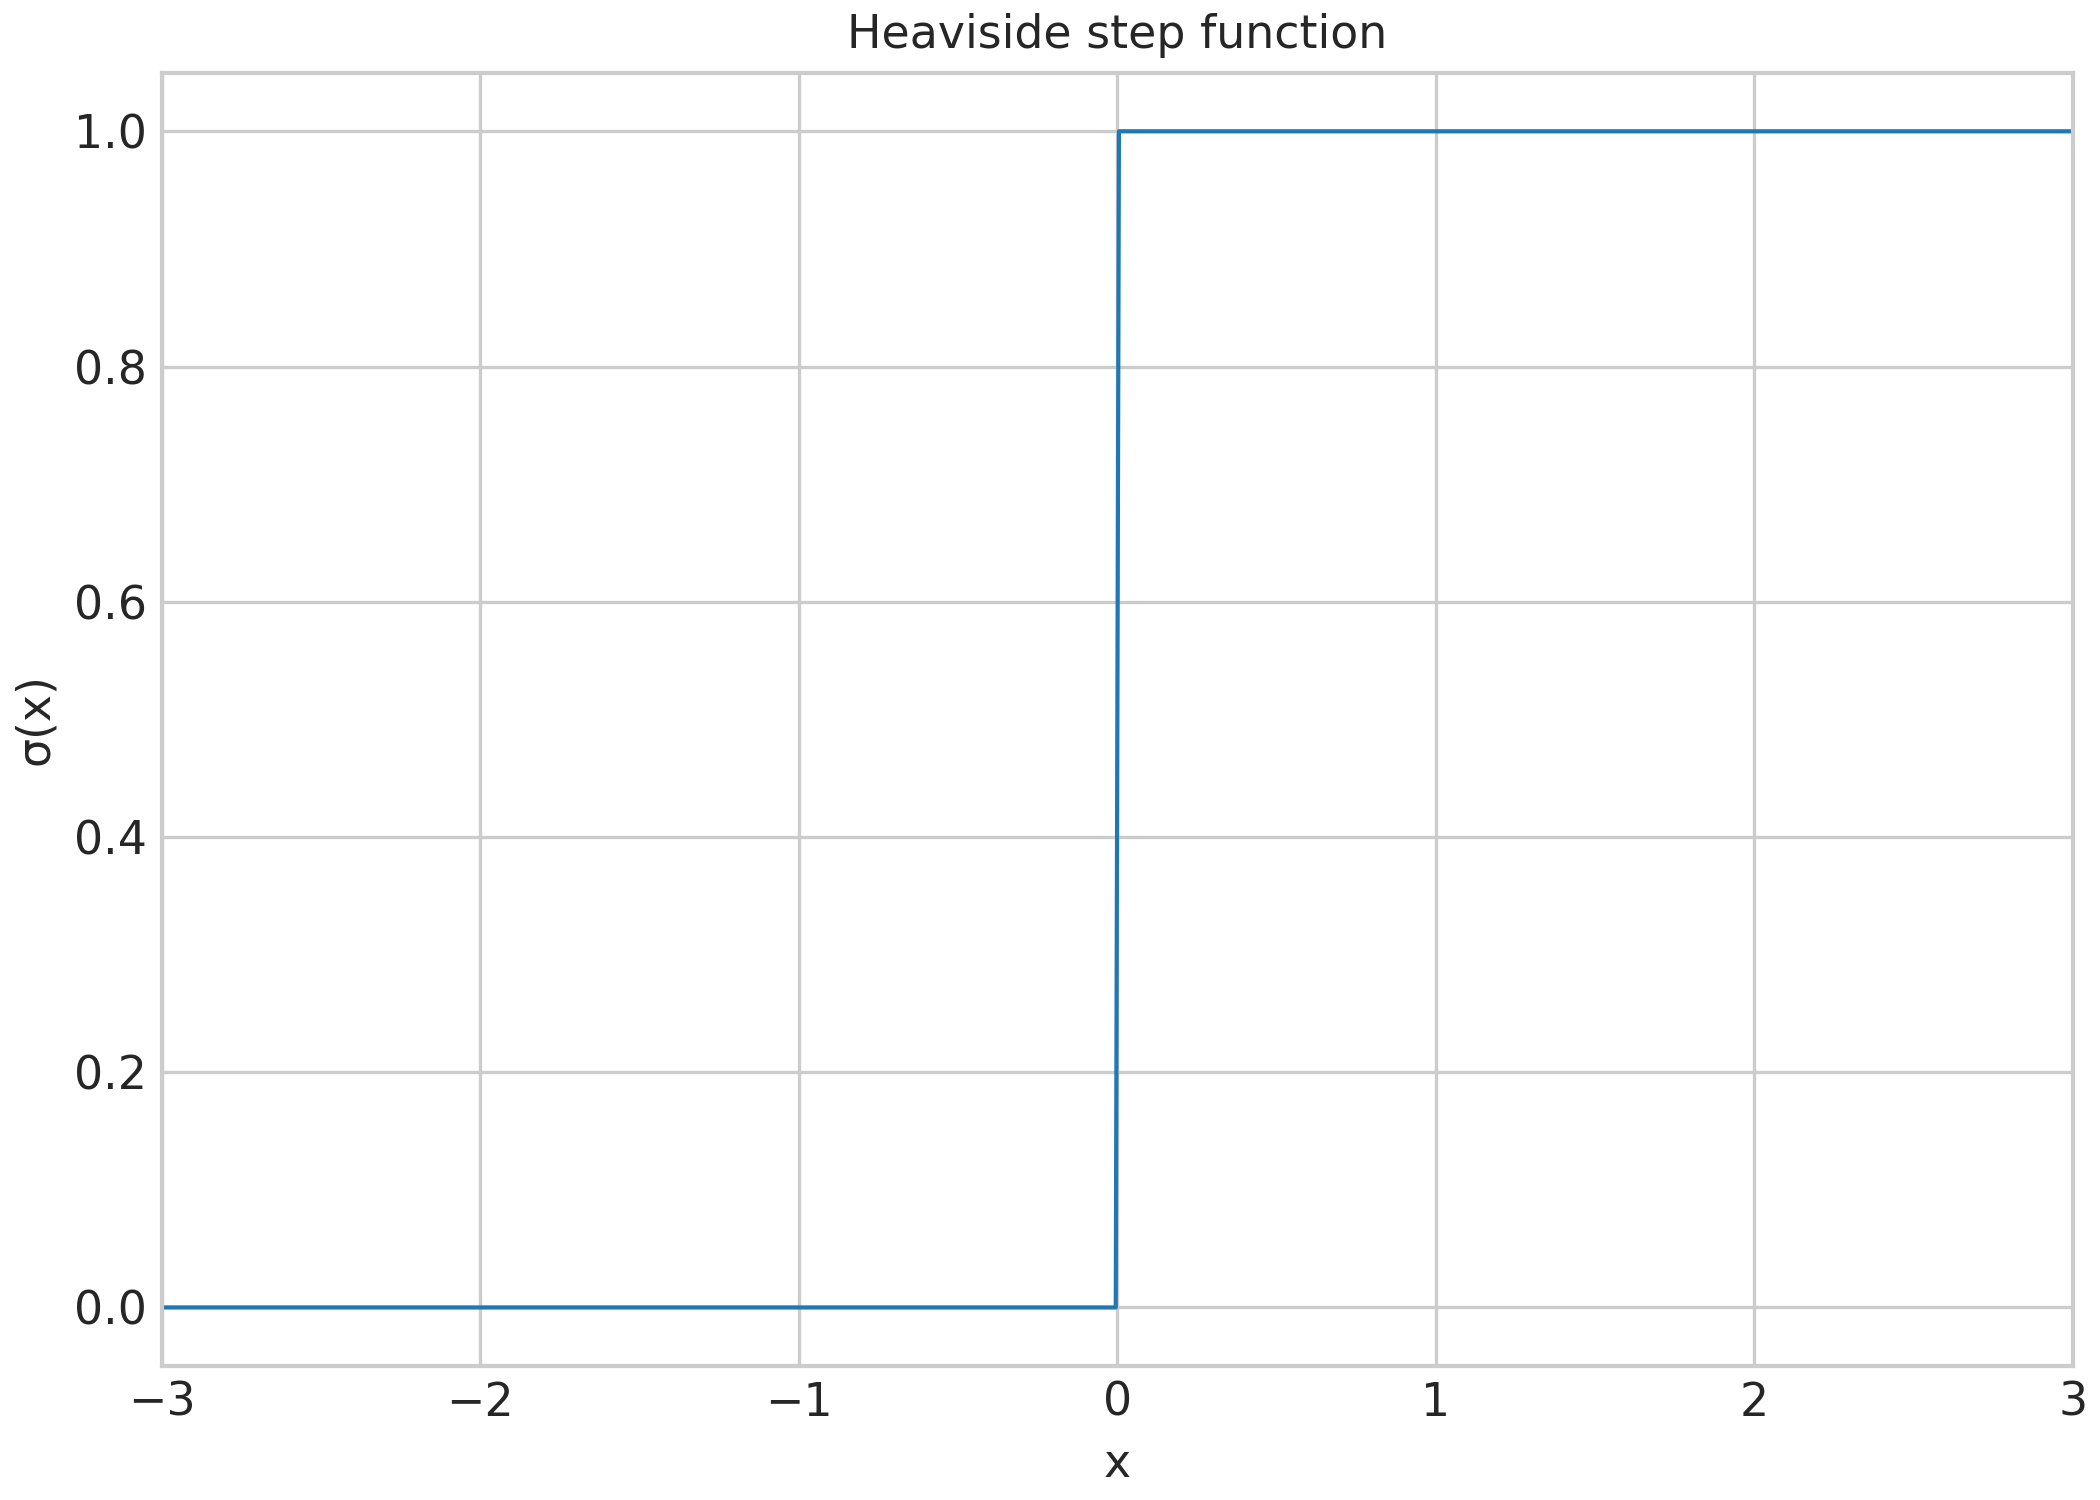
Heaviside Step Function#
sysplot.heaviside() evaluates the Heaviside step function over a NumPy
array. It returns 0 for negative inputs and 1 for positive inputs. The value
at exactly x = 0 is controlled by the default_value parameter, which is set to 1.
import numpy as np
import matplotlib.pyplot as plt
import sysplot as ssp

ssp.apply_config()

x = np.linspace(-3, 3, 600)

# Uses default_value from SysplotConfig (default: 1.0)
fig, ax = plt.subplots(figsize=ssp.get_figsize())
ax.plot(x, ssp.heaviside(x))
ax.set(title="Heaviside step function", xlabel="x", ylabel="σ(x)")
plt.show()
Total running time of the script: (0 minutes 0.217 seconds)