
Note
Go to the end to download the full example code.
Matplotlib Cycler#
This files shows inconsistencies when using the MatplotLib plotting functions.
sysplot.get_style() offers a way to fix these issues.
# _________________________________________________________
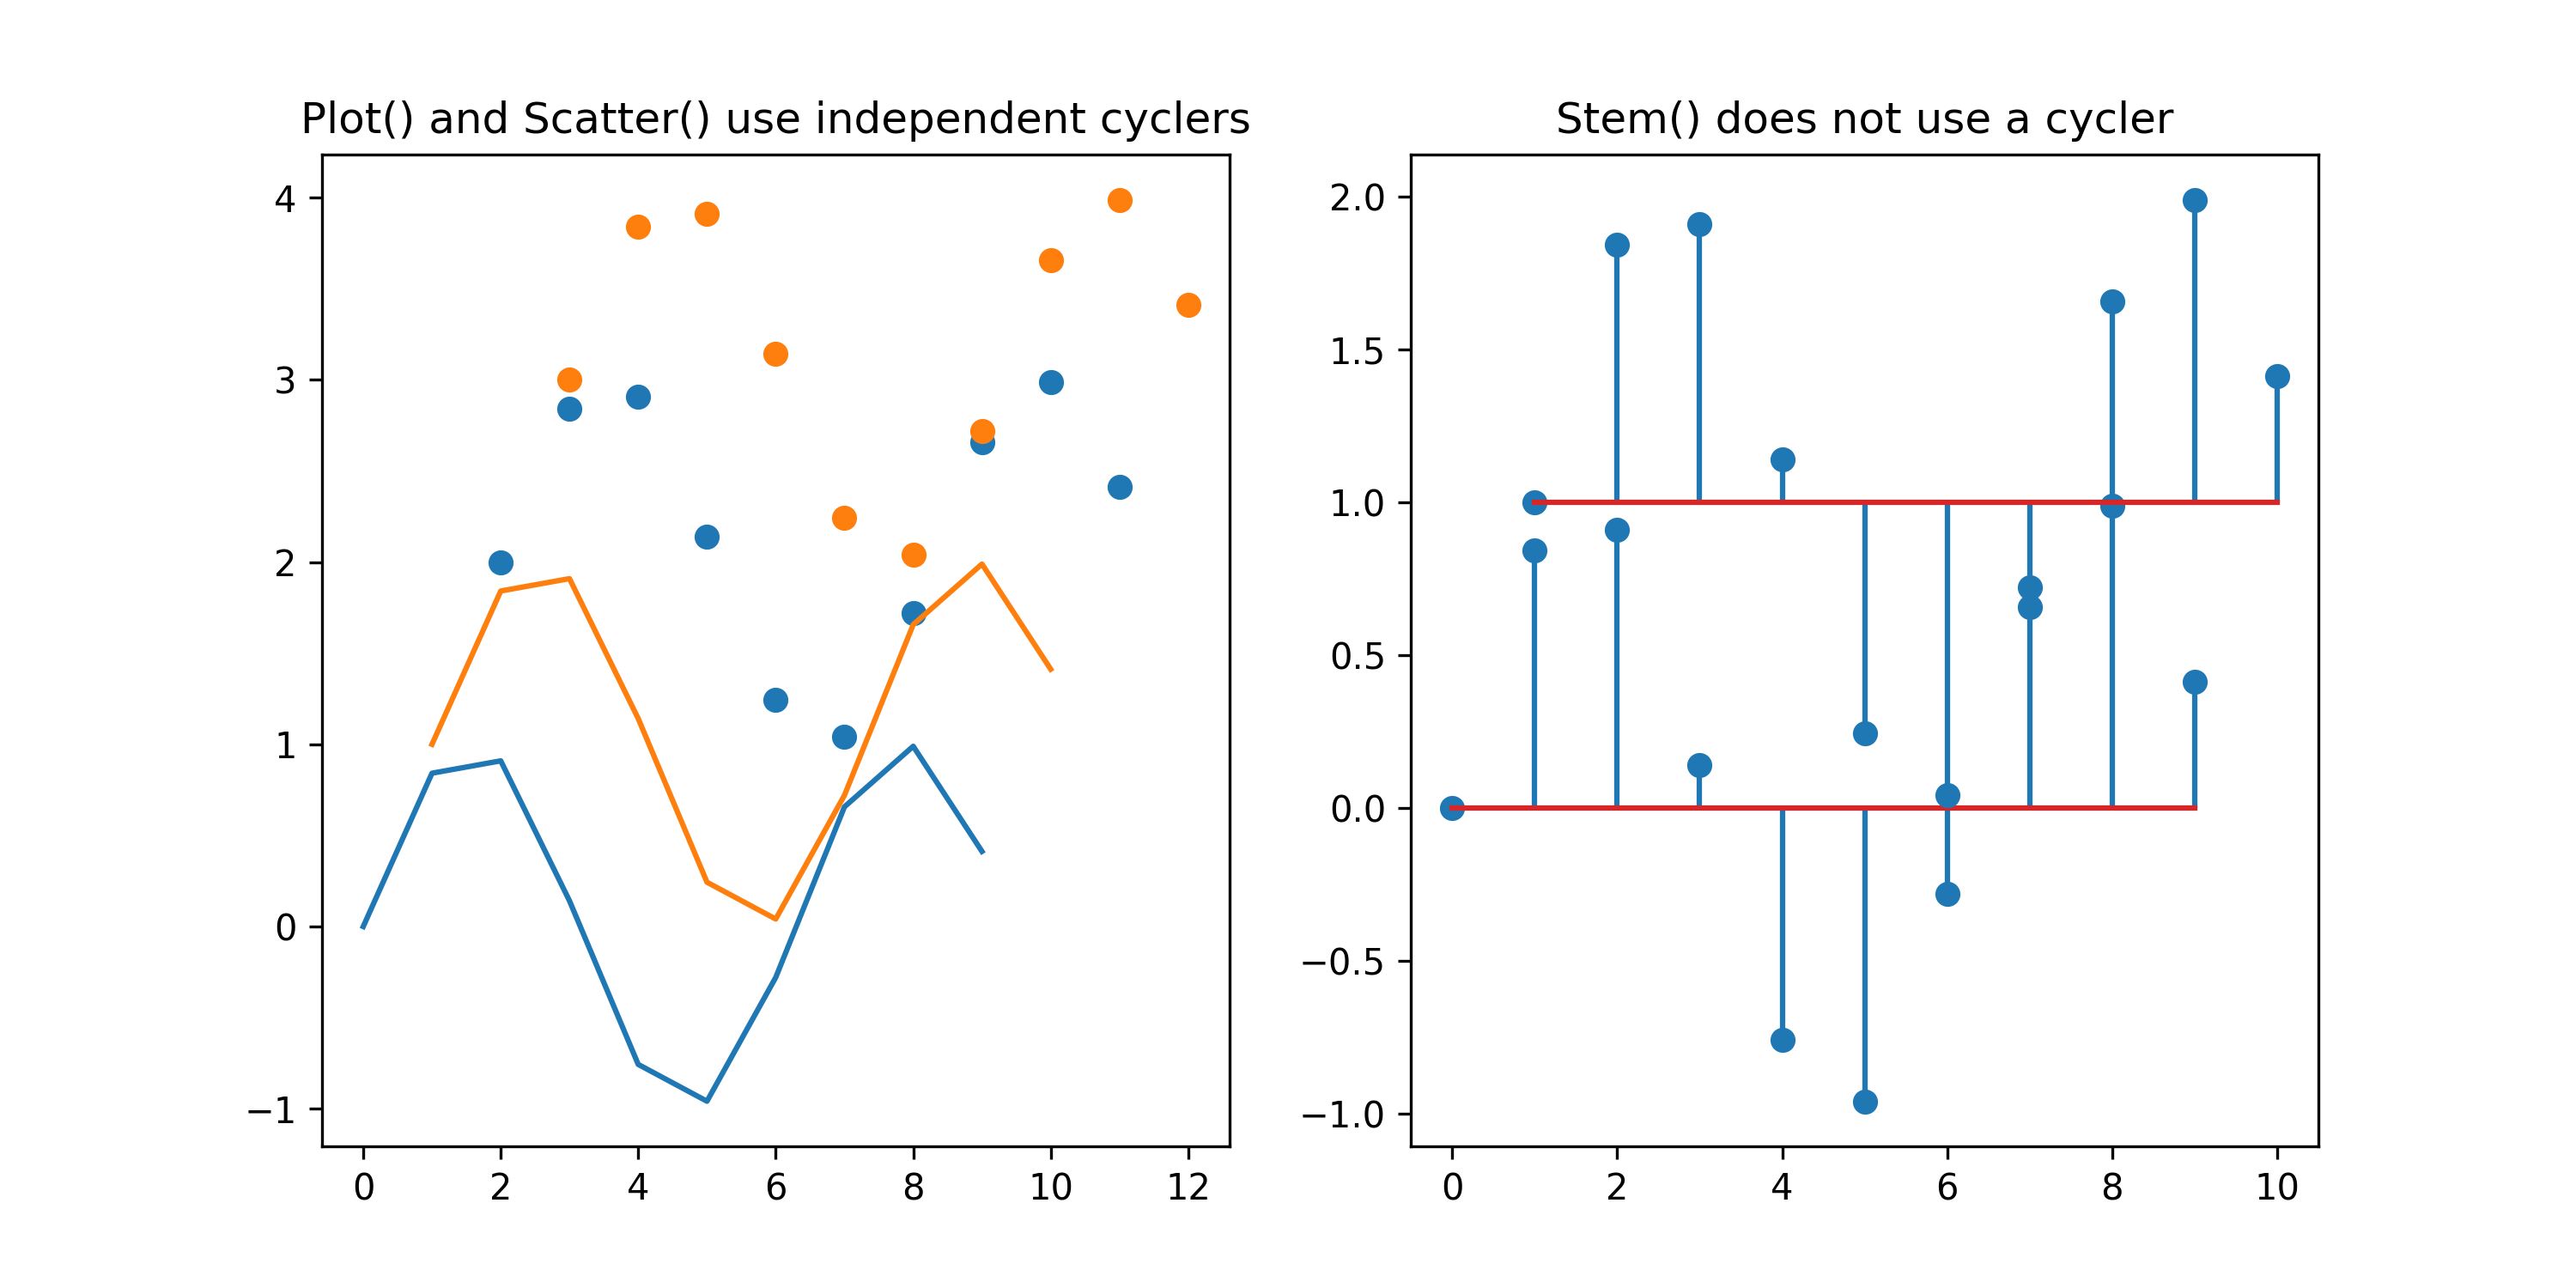
# Scatter and Plot have different Cyclers
import numpy as np
import matplotlib.pyplot as plt
x = np.arange(10)
y = np.sin(x)
fig, axes = plt.subplots(1, 2, figsize=(10, 5))
axes[0].plot(x, y)
axes[0].plot(x + 1, y + 1)
axes[0].scatter(x + 2, y + 2)
axes[0].scatter(x + 3, y + 3)
axes[0].set_title("Plot() and Scatter() use independent cyclers")
axes[1].stem(x, y)
axes[1].stem(x + 1, y + 1, bottom=1)
axes[1].set_title("Stem() does not use a cycler")
plt.show()
# _________________________________________________________
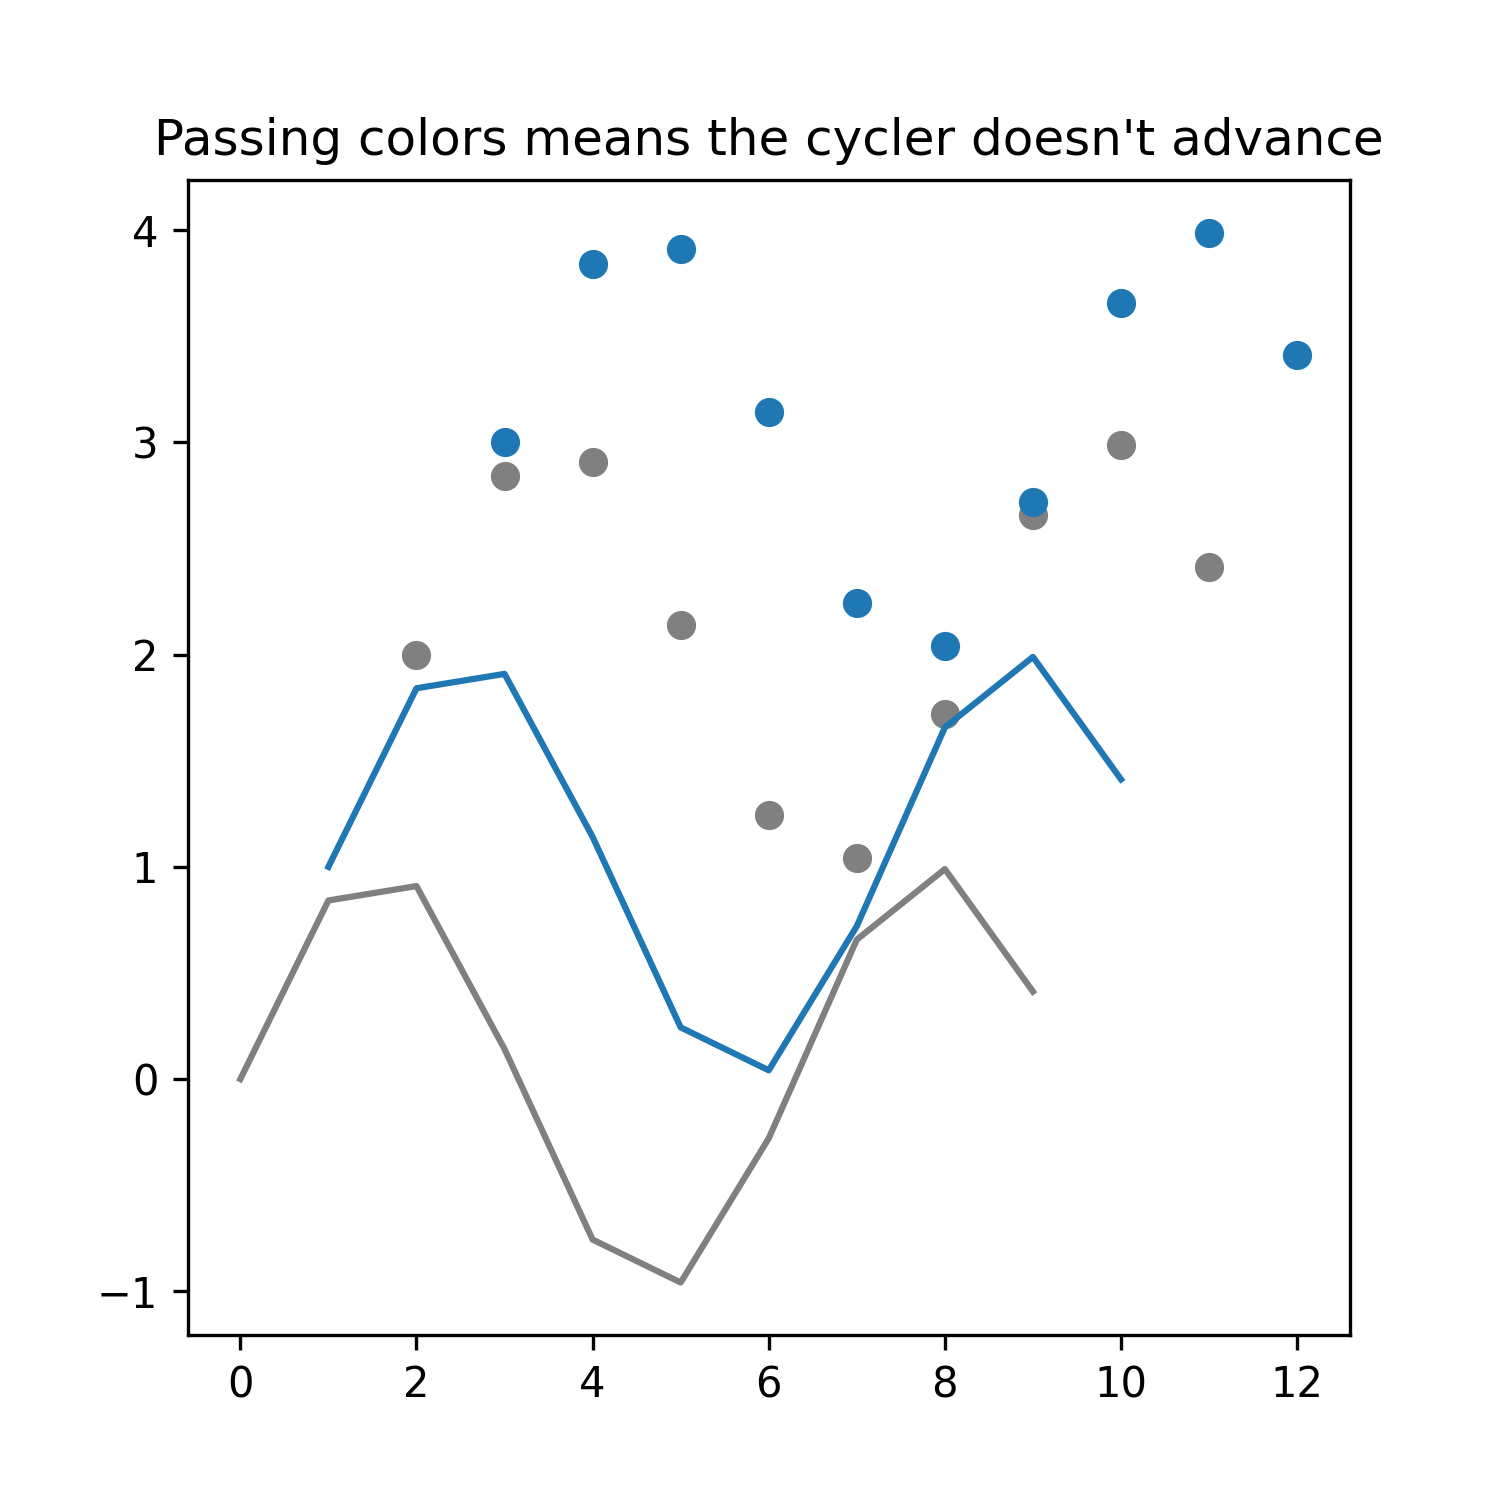
# Cycler does not advance with color=
fig, ax = plt.subplots(1, 1, figsize=(5, 5))
ax.plot(x, y, color="gray")
ax.plot(x + 1, y + 1)
ax.scatter(x + 2, y + 2, color="gray")
ax.scatter(
x + 3,
y + 3,
)
ax.set_title("Passing colors means the cycler doesn't advance")
plt.show()
# _________________________________________________________
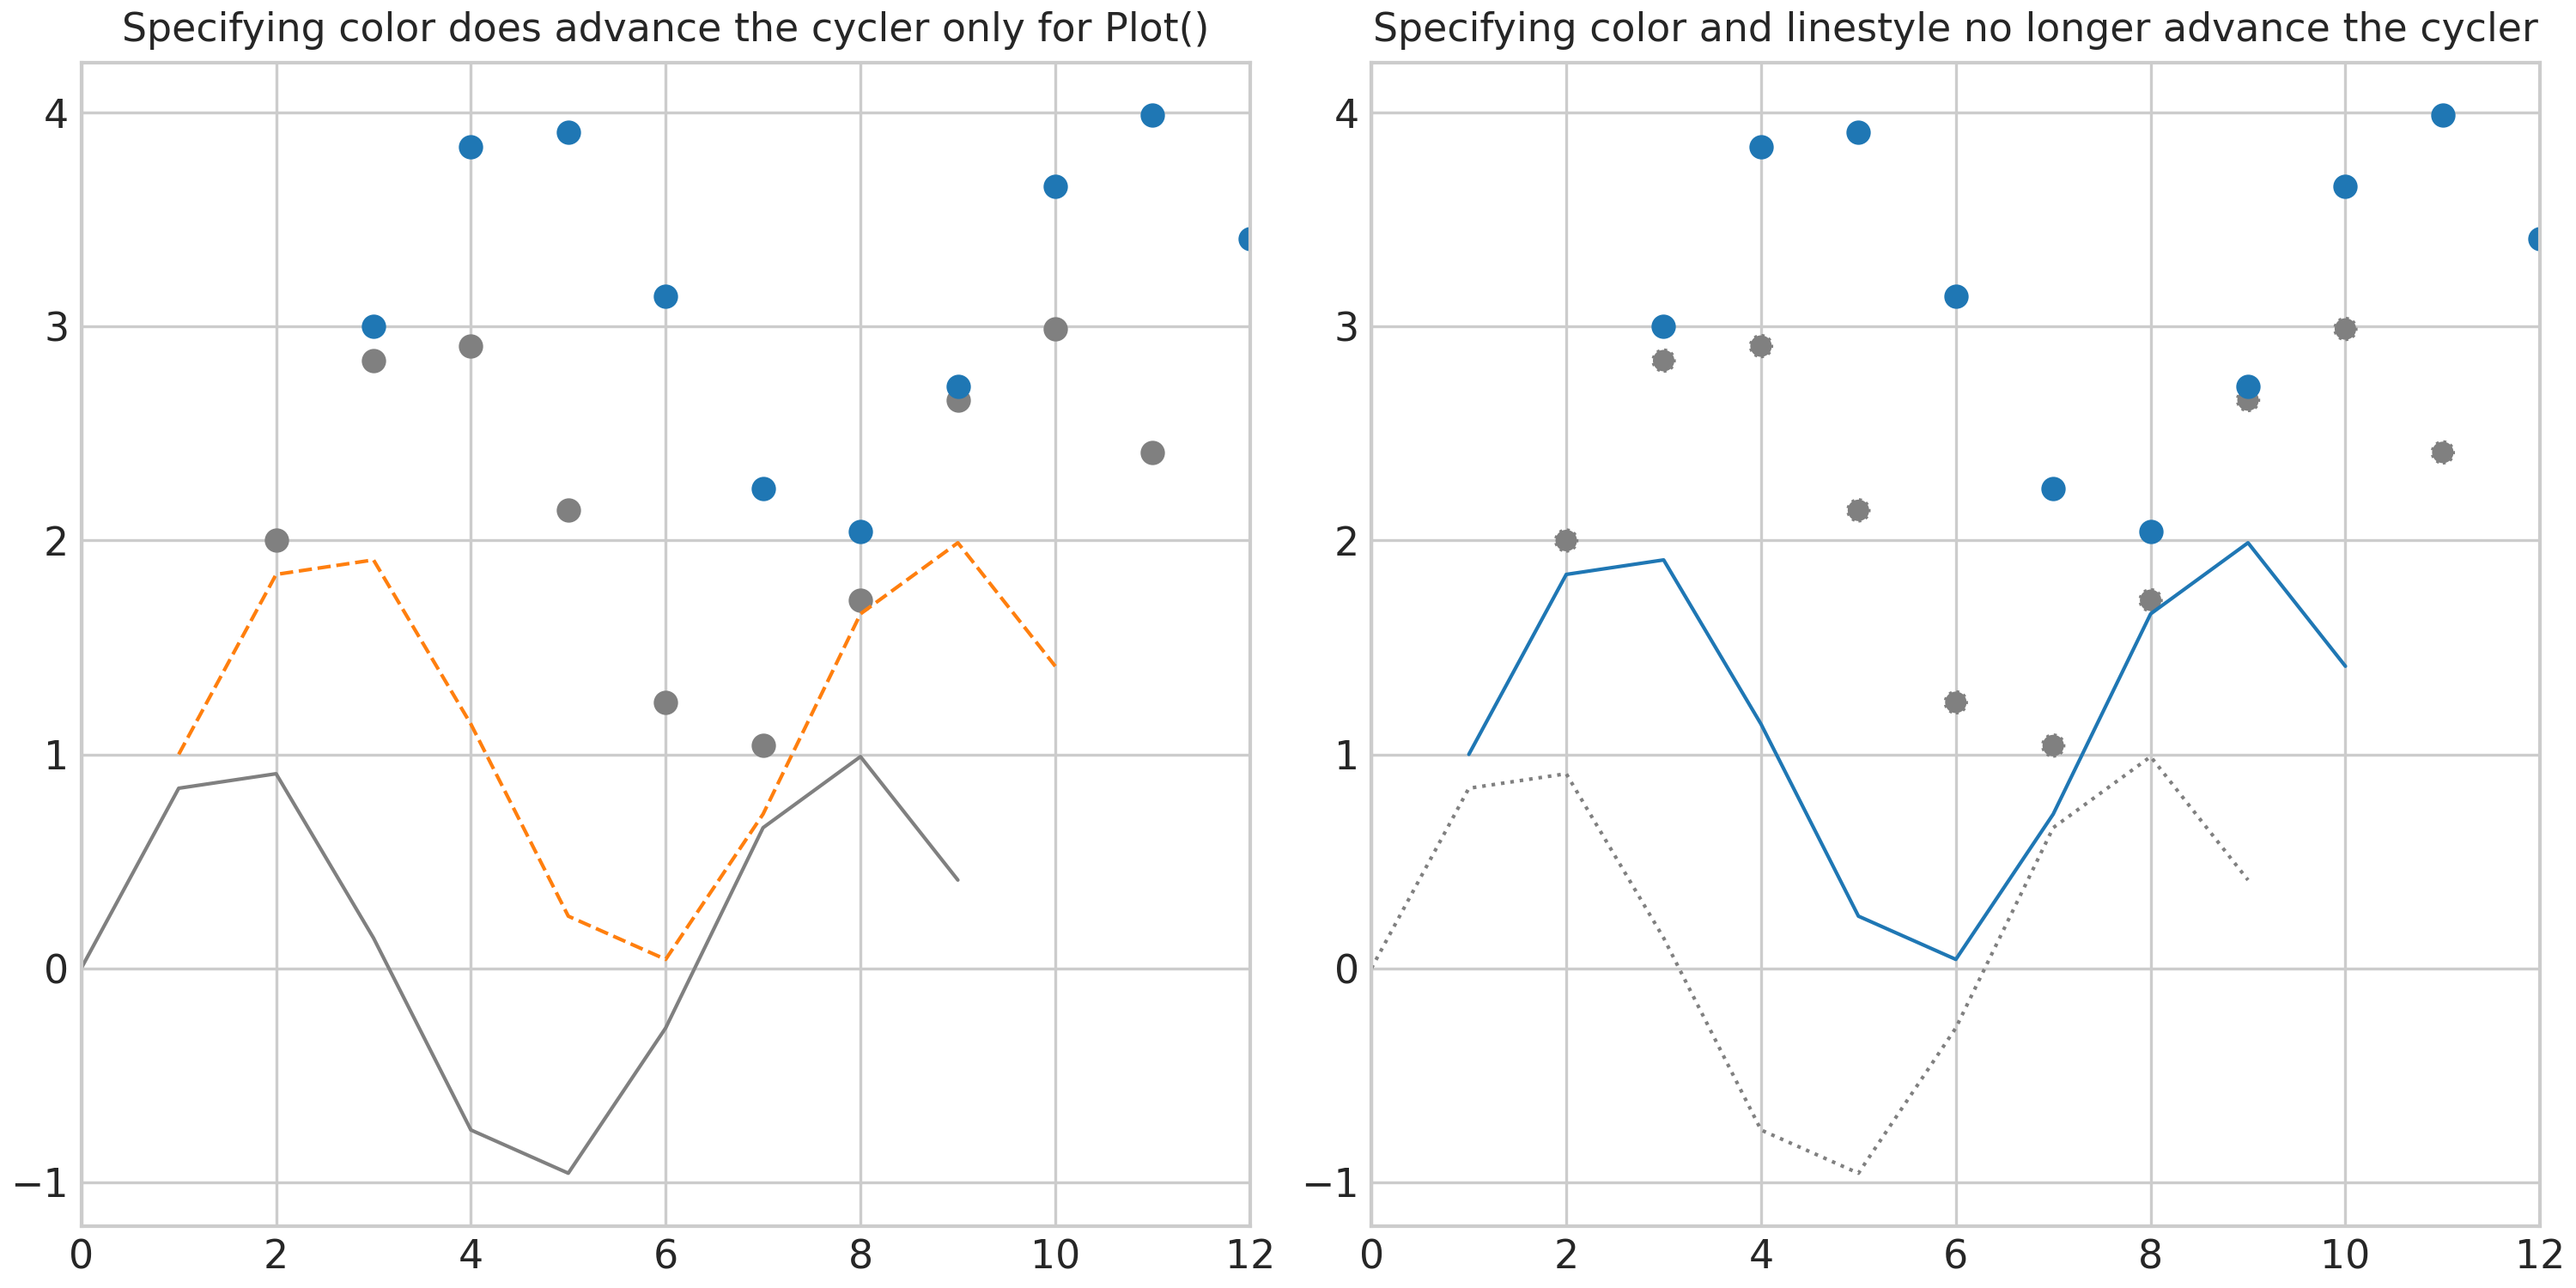
# Sysplot makes the previos a mess
import sysplot as ssp # # noqa: E402
ssp.apply_config()
fig, axes = plt.subplots(1, 2, figsize=(10, 5))
axes[0].plot(x, y, color="gray")
axes[0].plot(x + 1, y + 1)
axes[0].scatter(x + 2, y + 2, color="gray")
axes[0].scatter(x + 3, y + 3)
axes[0].set_title("Specifying color does advance the cycler only for Plot()")
axes[1].plot(x, y, color="gray", linestyle=":")
axes[1].plot(x + 1, y + 1)
axes[1].scatter(x + 2, y + 2, color="gray", linestyle=":")
axes[1].scatter(x + 3, y + 3)
axes[1].set_title("Specifying color and linestyle no longer advance the cycler")
plt.show()
# _________________________________________________________
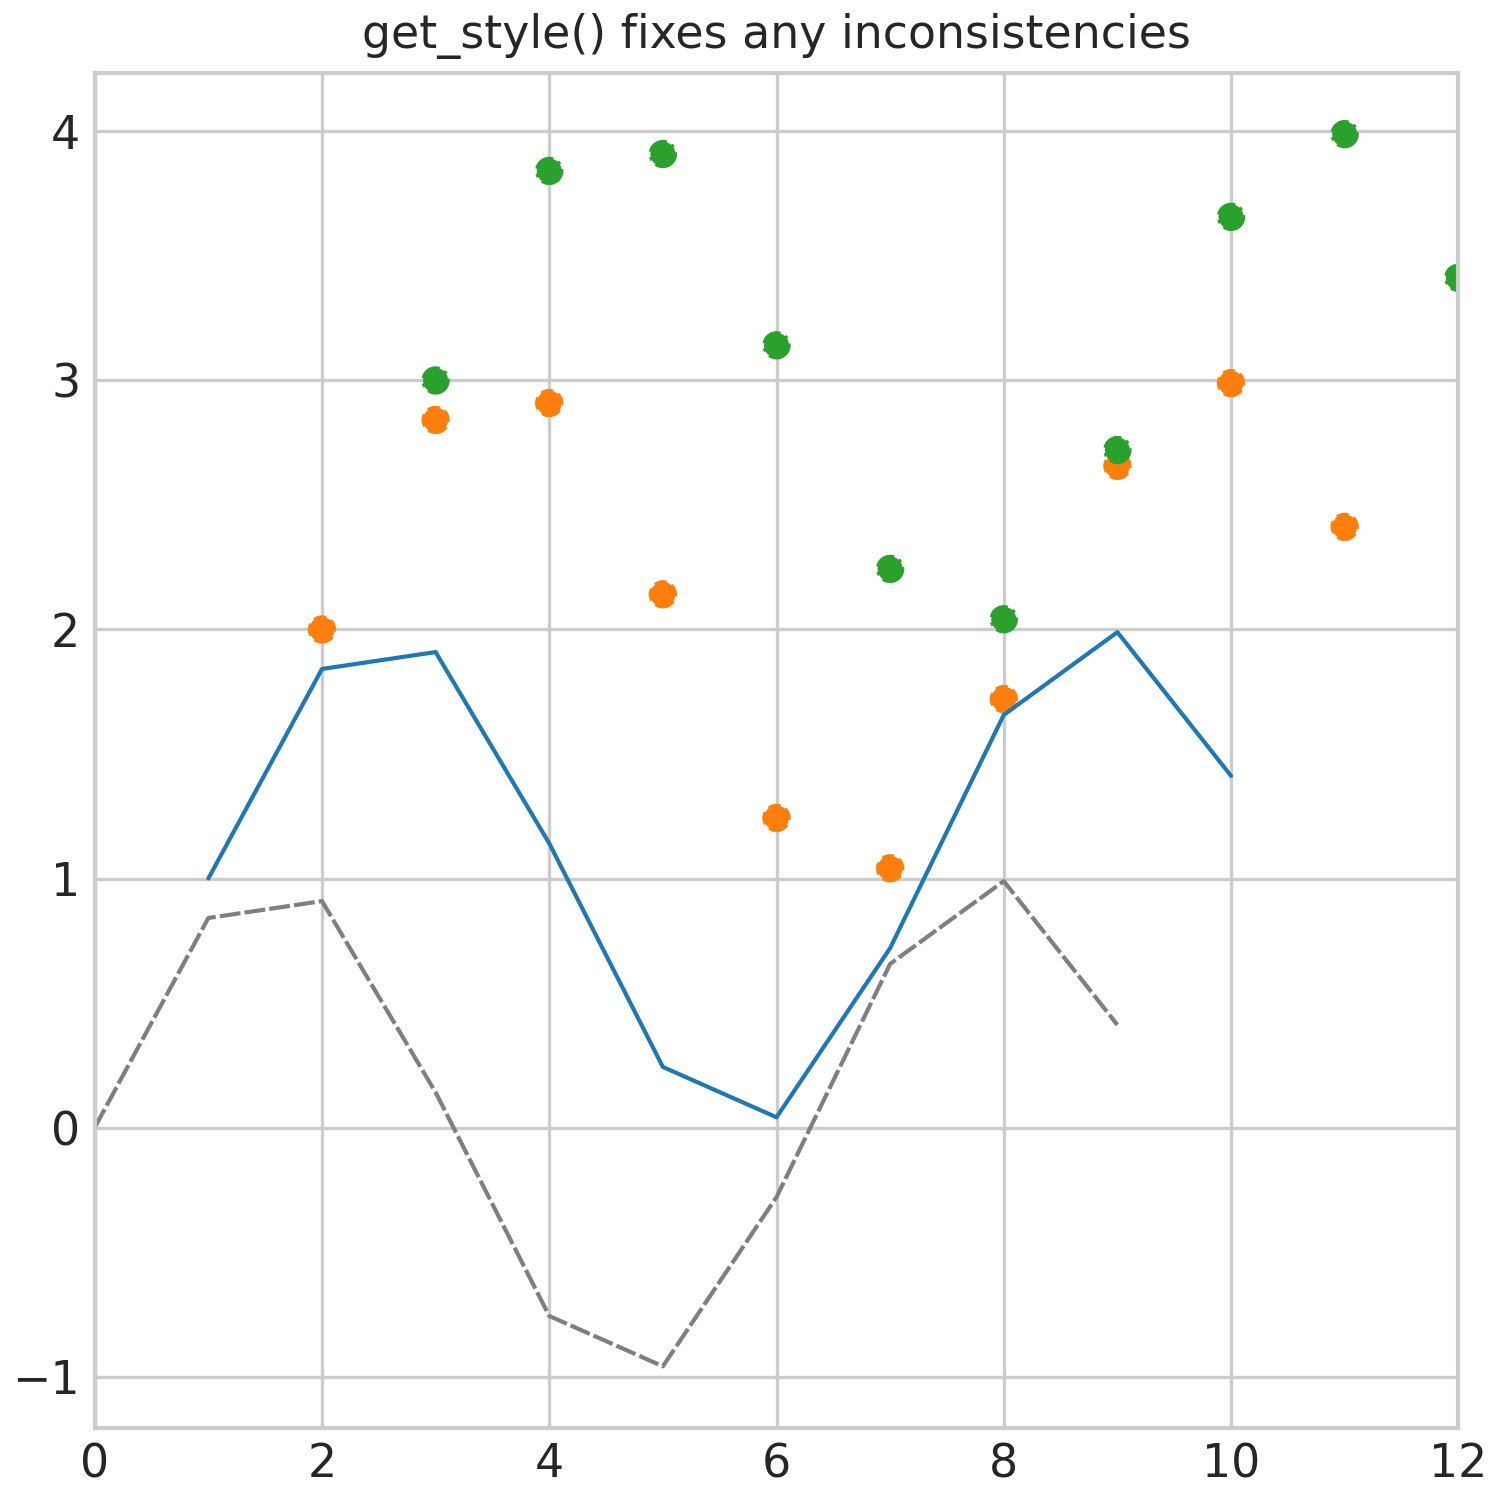
# get_style() fixes everything
ssp.apply_config()
fig, ax = plt.subplots(1, 1, figsize=(5, 5))
ax.plot(x, y, **ssp.get_style(index=7))
ax.plot(x + 1, y + 1)
ax.scatter(x + 2, y + 2, **ssp.get_style(ax=ax))
ax.scatter(x + 3, y + 3, **ssp.get_style(ax=ax))
ax.set_title("get_style() fixes any inconsistencies")
plt.show()
Total running time of the script: (0 minutes 0.982 seconds)