
Note
Go to the end to download the full example code.
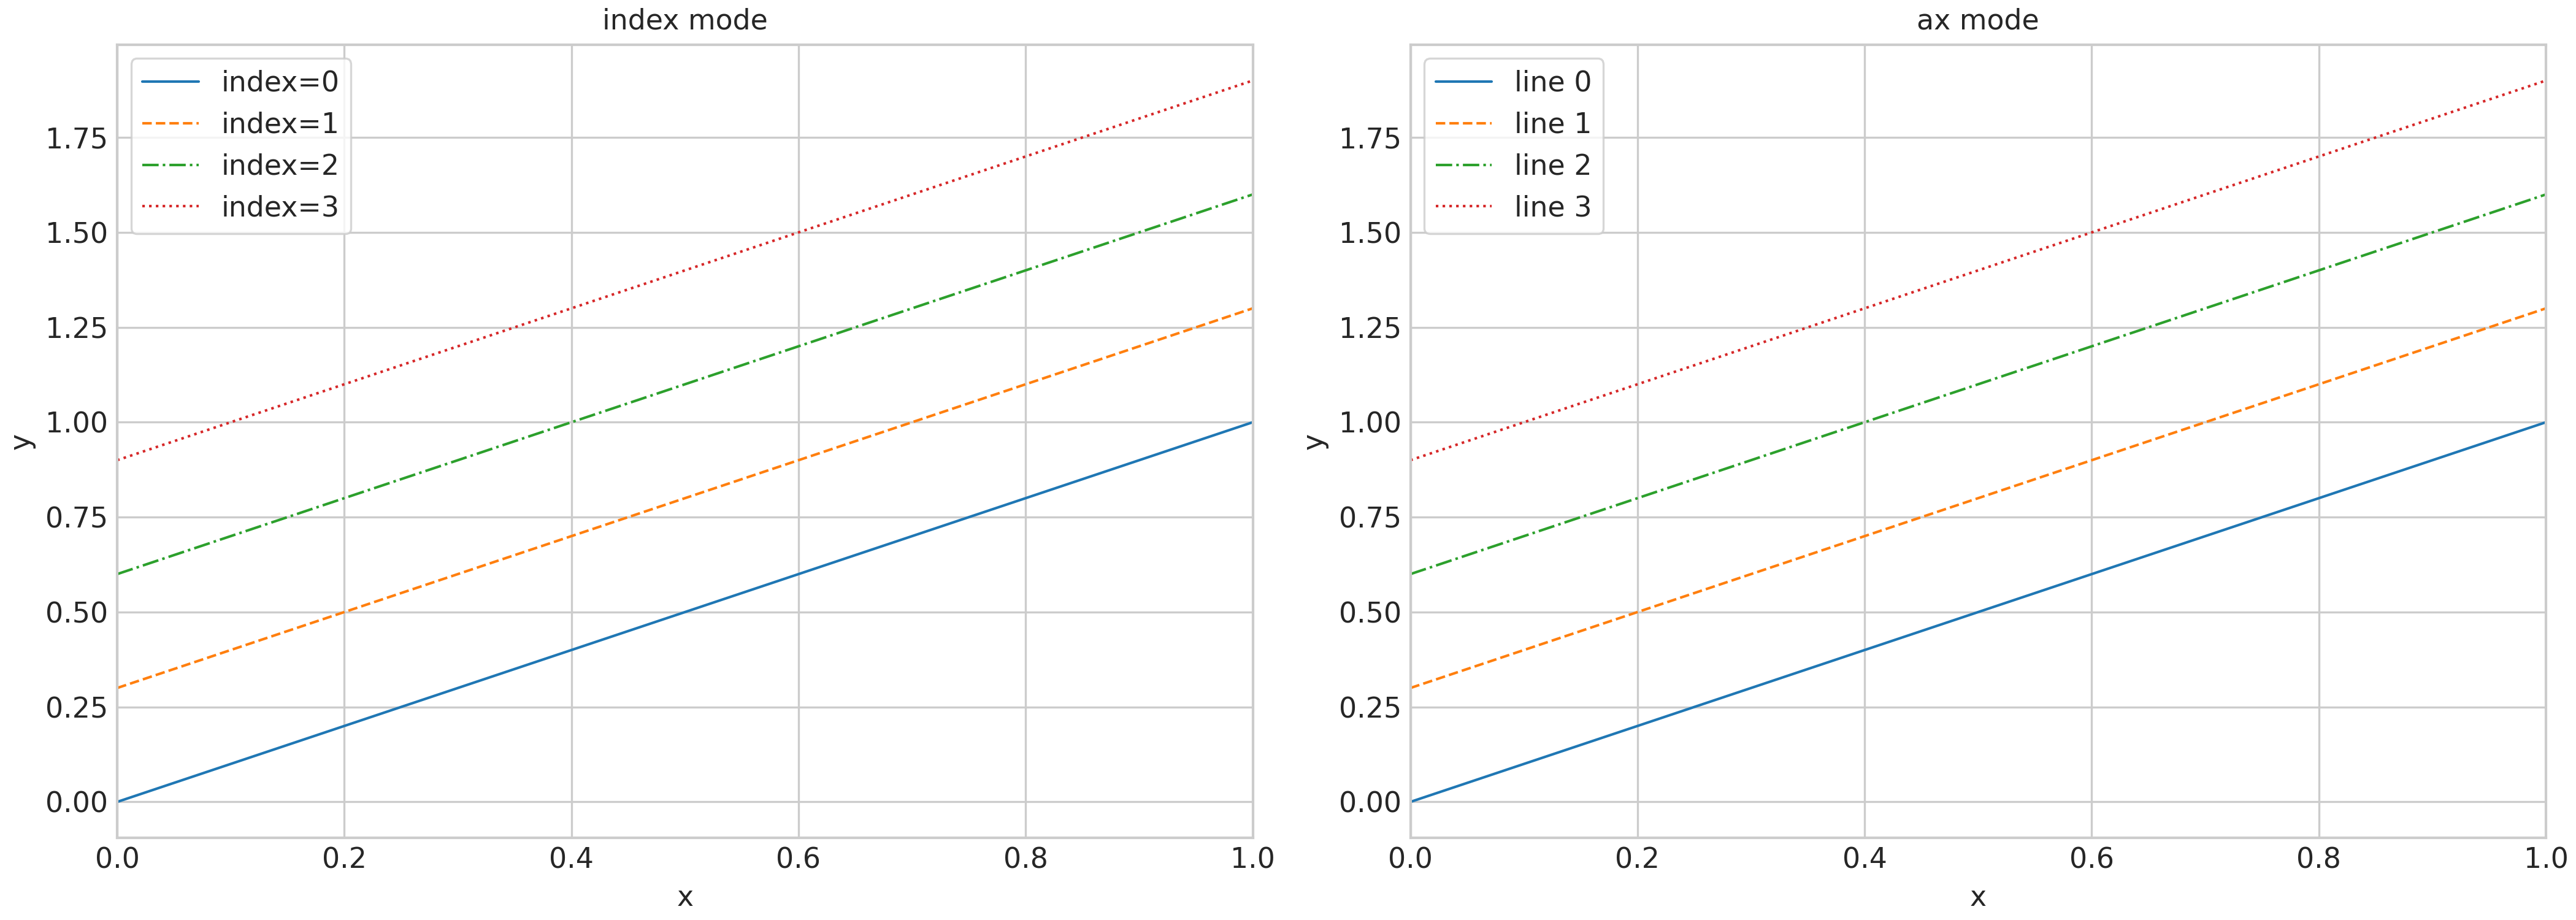
Get Style Example#
sysplot.get_style() returns a style dict (color, linestyle, marker)
from the configured cycler. Styles can be retrieved by explicit index
or by passing an ax to advance the cycler automatically.
import matplotlib.pyplot as plt
import numpy as np
import sysplot as ssp

ssp.apply_config()

x = np.linspace(0, 1, 50)

fig, (ax1, ax2) = plt.subplots(1, 2, figsize=ssp.get_figsize(1, 2))

# ── index mode ───────────────────────────────────────────────────────────────
# Each call picks a fixed slot from the cycler regardless of call order.
for i in range(4):
    ax1.plot(x, x + i * 0.3, label=f"index={i}", **ssp.get_style(index=i))

ax1.set(title="index mode", xlabel="x", ylabel="y")
ax1.legend()

# ── ax mode ───────────────────────────────────────────────────────────────────
# each call picks the next style from the cycler

for i in range(4):
    ax2.plot(x, x + i * 0.3, label=f"line {i}", **ssp.get_style(ax=ax2))

ax2.set(title="ax mode", xlabel="x", ylabel="y")
ax2.legend()

plt.show()
Total running time of the script: (0 minutes 0.492 seconds)