sysplot.plot_poles_zeros#
- plot_poles_zeros(poles=None, zeros=None, label=None, ax=None, markersize=None, show_origin=True, enable_xmargin=True, **kwargs)[source]#
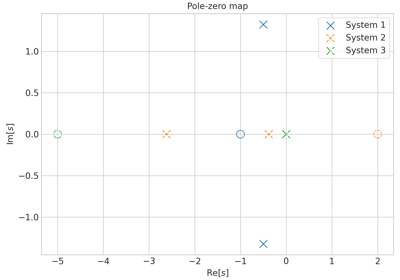
Plot poles and zeros on the complex plane.
Poles are drawn as
×markers and zeros as hollow circleso. Both share the same color and linestyle from the active style cycle. Either poles or zeros can be omitted by passingNoneor an empty list/array.- Parameters:
poles (
complex|list[complex] |ndarray|None) – Complex pole locations. Accepts a scalar, list, or array.zeros (
complex|list[complex] |ndarray|None) – Complex zero locations. Accepts a scalar, list, or array.label (
str|None) – Legend label. Applied to poles if present, otherwise to zeros.ax (
Axes|None) – Axes to plot on. Defaults to the current axes.markersize (
float|None) – Marker size. Defaults topoles_zeros_markersize.show_origin (
bool) – IfTrue, marks the origin to keep it in view.enable_xmargin (
bool) – IfTrue, adds a small x-axis margin so markers near the edges are not clipped.**kwargs –
Additional keyword arguments forwarded to
matplotlib.axes.Axes.scatter()for both pole and zero markers.If
colororlinestyleare not provided, they are taken from the active sysplot style cycler. Passingcolorand/orlinestyleinkwargsoverrides those defaults.
- Return type:
None
Examples using
sysplot.plot_poles_zeros#- rtype:
None