sysplot.plot_filter_tolerance#
- plot_filter_tolerance(ax, bands, A_pass, A_stop, w_max, mag_to_db=False, show_mask=True, show_arrows=True, show_labels=False, set_ticks=True, arrow_y=-0.2, alpha=None)[source]#
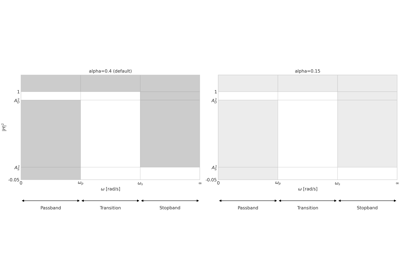
Draw a filter power tolerance mask on an existing axes.
Shades the forbidden regions of a filter specification. Each entry in
bandsis adictwith the following keys:"type":"pass","stop", or"transition""w0": lower frequency bound"w1": upper frequency bound"label"(optional): band annotation text"w0_label"/"w1_label"(optional): tick label overrides
Note
Axis y-limits must be set before calling this function, as the forbidden-region patches are sized from the current limits.
- Parameters:
ax (
Axes) – Axes to draw on.bands (
list[dict]) – List of band specification dicts (see above).A_pass (
float) – Lower passband power bound (A_D²).A_stop (
float) – Upper stopband power bound (A_S²).w_max (
float) – Maximum frequency for the x-axis.mag_to_db (
bool) – IfTrue, converts power bounds to dB before plotting.show_mask (
bool) – IfTrue, shades the forbidden regions.show_arrows (
bool) – IfTrue, draws double-headed arrows with band labels below the axis.show_labels (
bool) – IfTrue, adds legend labels to the shaded patches.set_ticks (
bool) – IfTrue, sets frequency and amplitude tick marks from the band definitions.arrow_y (
float) – Vertical position of band arrows in axes coordinates. Default is-0.2.alpha (
float|None) – Opacity of shaded regions. Defaults tofilter_tolerance_alpha.
- Return type:
None
Examples using
sysplot.plot_filter_tolerance#- rtype:
None